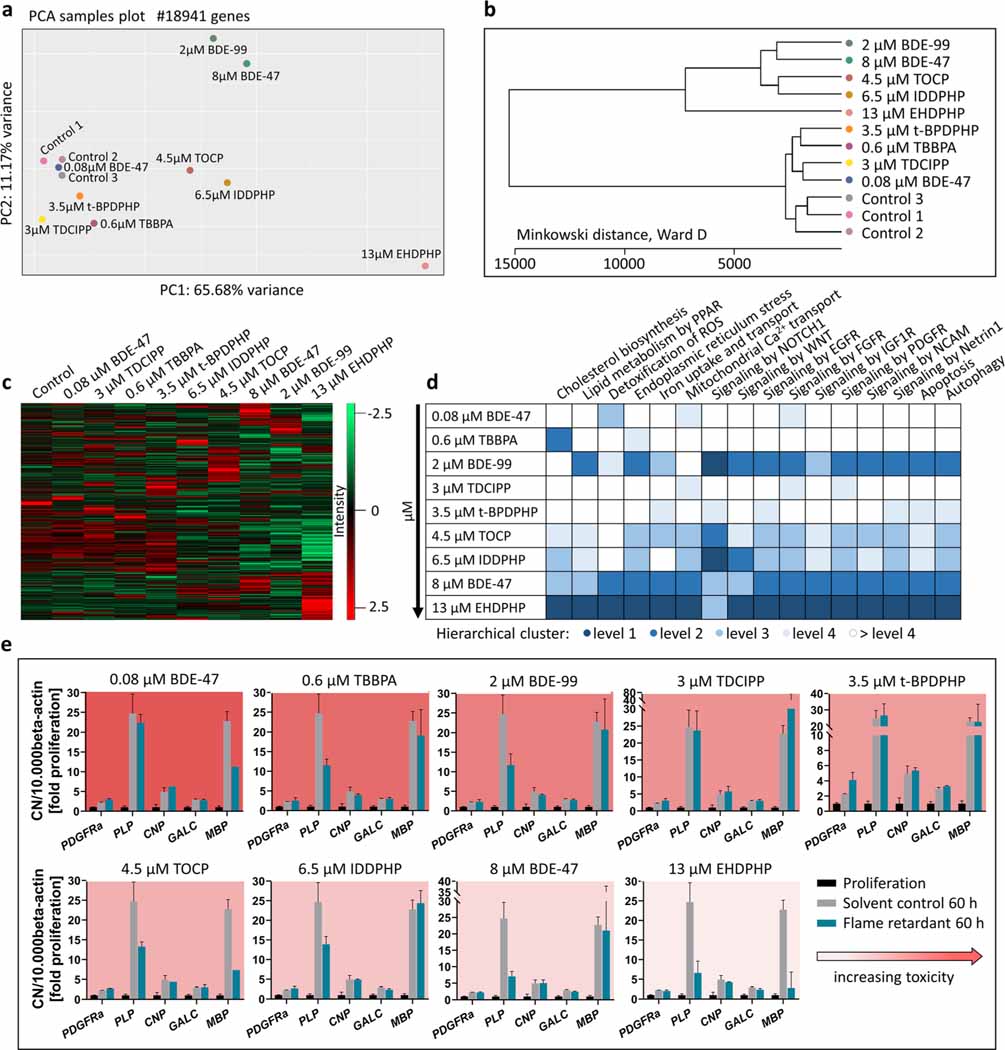
Fig. 6.
RNA sequencing and RT-qPCR. Human NPCs differentiated for 60 h in the presence of 0.6 μM TBBPA, 2 μM BDE-99, 3 μM TDCIPP, 3.5 μM t-BPDPHP, 4.5 μM TOCP, 6.5 μM IDDPHP,8 μM BDE-47, and 13 μM EHDPHP. These concentrations represent the BMC50 values of oligodendrocyte differentiation inhibition. 0.08 μM BDE-47 induced oligodendrocyte differentiation. Controls 1–3 represent spheres plated in solvent control 0.1% DMSO. PCA (a) and Minkowski distance plot (b) analyses were performed using the PCAGO online software (https://pcago.bioinf.uni-jena.de/) as previously described (Gerst and Hölzer 2019). Both plots were generated by normalizing the total number of reads of different samples to the Transcript per Kilobase Million (TPM) count. The heatmap (c) was generated using Perseus Version 1.6.2.2 (https://www.maxquant.org/perseus/). Therefore, the Z-scores of TPM values were used with a cut-off of one valid value per condition. Classification of impact on oligodendrocyte differentiation-relevant pathways (d) was performed by expert judgment based on hierarchical clustering of pathway-related genes (Suppl. Fig. 6) and was categorized into four levels (level 1 as most and level 4 as least distanced to one merged control). Gene expression (e) of platelet-derived growth factor receptor A (PDGFRα), proteolipid protein (PLP), cyclic-nucleotide-phosphodiesterase (CNP), galactosylceramidase (GALC) and myelin basic protein (MBP) was assessed via RT-qPCR and normalized to the housekeeping gene beta actin (ACTB). In addition to solvent control (gray bars), proliferative spheres (black bars) were used as an internal control. Data are represented as mean ± SD from 1 to 3 biological replicates

