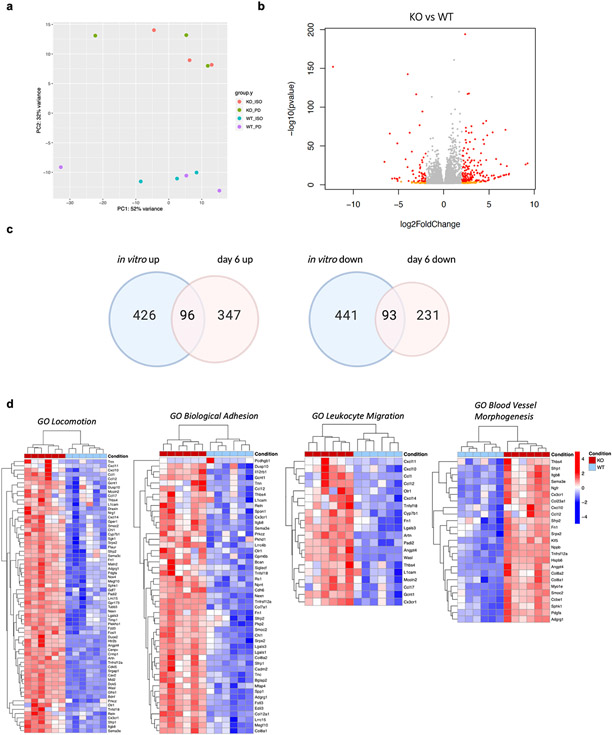
Figure 3: Transcriptomic characterization of early in vivo PAK4 KO tumors reveals major changes in the tumor microenvironment.
a, Principal component analysis (PCA) of 12 in vivo samples (6 B16 KO and 6 B16 WT CC). In this case, principal component 2 (PC2) is related to PAK4 expression and explains almost 32% of the variance of this cohort. b, Volcano plot derived from the differential gene expression analysis between B16 PAK4 KO and B16 WT CC tumors, regardless of anti-PD-1 treatment. In red, genes with log2FC > 1 or < −1 and p-value < 5e-05. In orange, genes with log2FC > 1 or < −1 and p-value < 0.05. In grey, genes that do not fall in any of the two previous categories. c, Venn diagram showing the overlap between DEG (q < 0.05 and log2FC >1 or <−1) in vitro and early in vivo samples. d, Heatmap (raw z-score) of four enriched GO signatures: locomotion, biological adhesion, leukocyte migration and blood vessel morphogenesis, after GSEA with the DEG from comparing B16 KO vs B16 WT CC tumors. Again, samples are separated based on PAK4 expression (condition: B16 WT and B16 KO).

