
Figure 1. CD19-targeted CAR T cell–mediated cytotoxicity consumes extracellular phosphate in vitro.
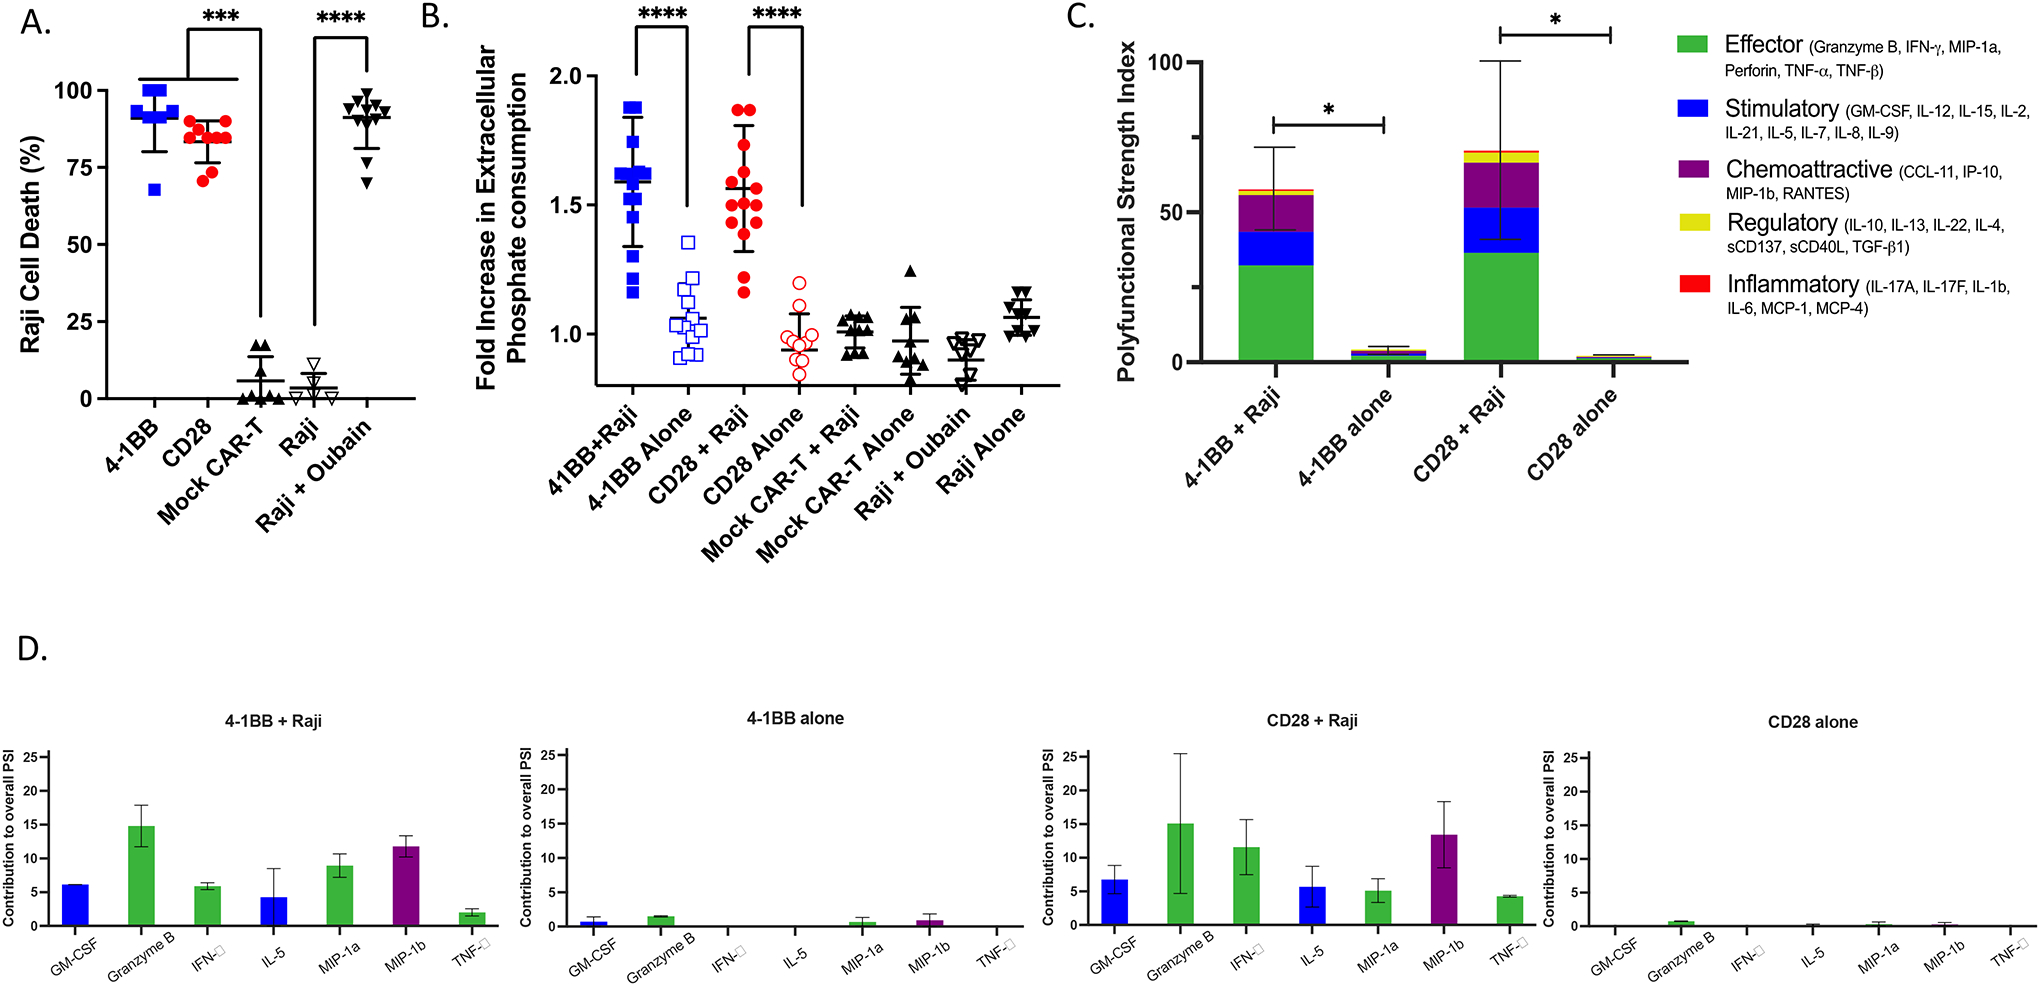
(A) Tumor cell lysis during co-culture killing assay. 4–1BB and CD28 CD19-targeted CAR T cells were co-cultured with CD19+ Luciferase+ Raji tumor cells at a 10:1 effector:target ratio for 48 hours. Raji cells were also co-cultured with the pro-apoptotic agent ouabin as a positive control. Cell death was measured via firefly luciferase luminescence compared to non-CD19-targeting mock CAR T cells co-cultured with Raji cells (n=9, 3 experiments). (B) Phosphate content in the media from CAR T cells cultured alone or with CD19+ Raji target cells was quantified using a colorimetric assay and reported as a fold increase in phosphate consumption compared to the mock CAR T-cell co-culture (41BB, CD28 CAR T n=15, Mock n=10; 5 experiments). (C) 32-plex single-cell cytokine secretion profile of CD19-targeted CAR T cells in the presence or absence of Raji cells categorized into domains of cytokinetic polyfunctionality. Polyfunctional strength index (PSI) aggregates all single-cell multidimensional data into a single index, defined as the percentage of polyfunctional cells, multiplied by the sum of the mean fluorescence intensity of the proteins secreted by those cells, which are subdivided into different functional categories of cytokines (effector, stimulatory, chemoattractive, regulatory, and inflammatory cytokines). The aggregate cytokine secretome PSI of T cells bearing either the 41BB or CD28 CD19-targeted CAR constructs were significantly increased in the presence of their target antigen (n=3). (D) The PSI composition further uncovers GM-CSF, Granzyme B, IFNγ, IL-5, MIP-1α, MIP-1β, and TNF-α as the major drivers for the increased antigen-driven PSI. Profiles were broken down by cytokine, between functional categories, to reveal the specific proteins driving the PSI. Data are plotted as mean +/− SEM. * p <0.05, *** p<0.001, **** p<0.0001, unpaired t-test.