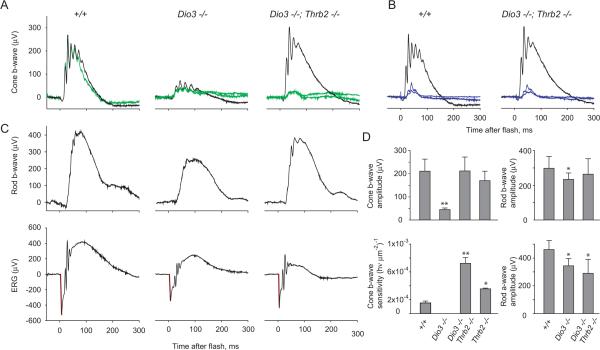
Figure 6. Electroretinogram responses in Dio3−/− and Dio3−/−;Thrb2−/− mice.
A, Full field cone-driven responses to achromatic and long wavelength stimuli. Black traces, saturating responses to bright (2000 scot cd m-2) white flashes (total cone response); green traces, responses to orange (λ >530 nm) flashes (M opsin+ cone response). In +/+ mice, an orange flash of 600 scot cd m-2 elicits a response almost identical to the saturating response to a white stimulus indicating that most cones express some M opsin (Lyubarsky et al., 1999). In Dio3−/− mice, amplitudes of saturating responses to white and orange flashes are ~5 fold smaller than in +/+ mice. In Dio3−/−;Thrb2−/− mice, white flashes elicit saturating cone responses of normal magnitude but orange flashes of any intensity (70 and 600 scot cd m-2)(green traces) generate only a small response consistent with lack of M opsin.
B, Cone-driven ERGs generated by short wavelength stimuli. Black traces, saturating responses elicited with bright (2000 scot cd m-2) white flashes. Blue traces, responses to ultraviolet (360 nm) flashes with estimated intensities of (photons μm-2 at the retina) 660 and 1320 for +/+ mice and 140 and 250 for Dio3−/−;Thrb2−/− mice. Similar magnitudes of response are elicited with ~5-fold dimmer stimulus in Dio3−/−;Thrb2−/− than in +/+ mice.
C, ERGs of dark-adapted mice. Top panels, responses to dim (0.02 scot cd m-2 s) flashes of green (510 nm) light. In these conditions, ERGs are represented by rod-driven (scotopic) b-waves of saturating magnitude and reflect primarily the magnitude of the rod bipolar cells’ circulating current. Bottom panels, responses to bright (200 scot cd m-2 s) achromatic flashes that saturate the a-wave amplitude, which is proportional to the rod photoreceptors’ circulating current. The corneal negative a-wave component is highlighted in red.
D, Bar charts of mean values (± sd) for ERG components and properties illustrated in panels A-C for groups of mice. Groups: 10 +/+, 7 Dio3−/−, 6 Dio3−/−;Thrb2−/−, 8 Thrb2−/− mice. Statistically significant differences in mutant mouse groups compared to +/+ mice are identified by asterisks: *, p < 0.05; **, p < 0.01 (1-tail t-tests).

