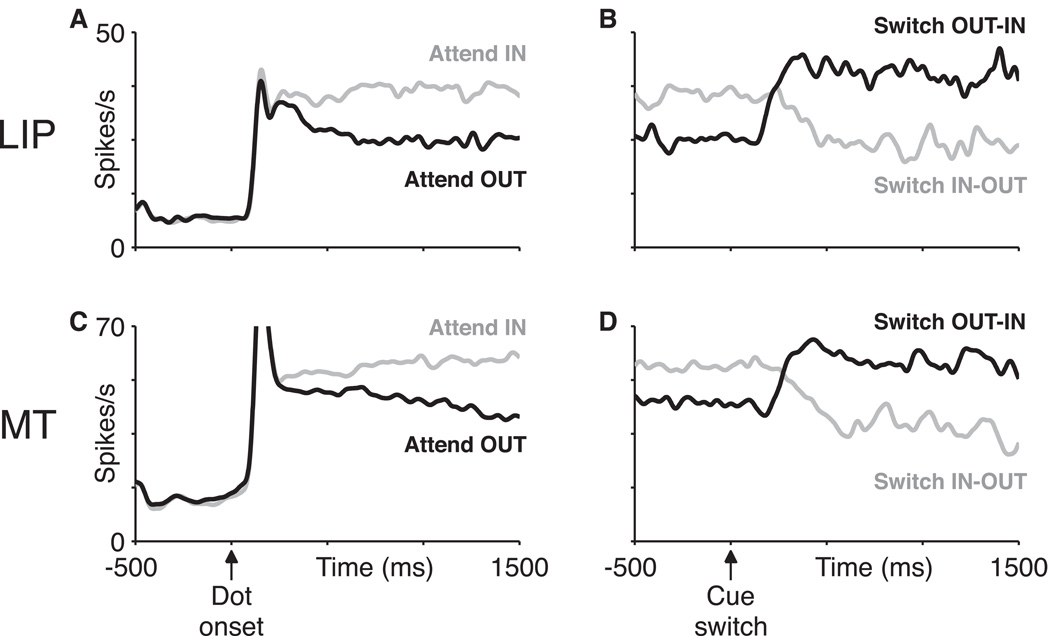
Figure 2. Example single-neuron responses in LIP and MT.
Average neural response rates as a function of time are shown for an LIP (A,B) and an MT (C,D) neuron. Both neurons were from monkey M. Left panels (A,C) show activity on non-switch trials aligned on the initial onset of the moving dots. Right panels (B,D) show activity on switch trials aligned on the cue switch. In each plot activity is shown separately depending on whether attention was cued into or out of the neuron’s receptive field. Data from each trial were used only up until the time of the speed pulse on that trial.

