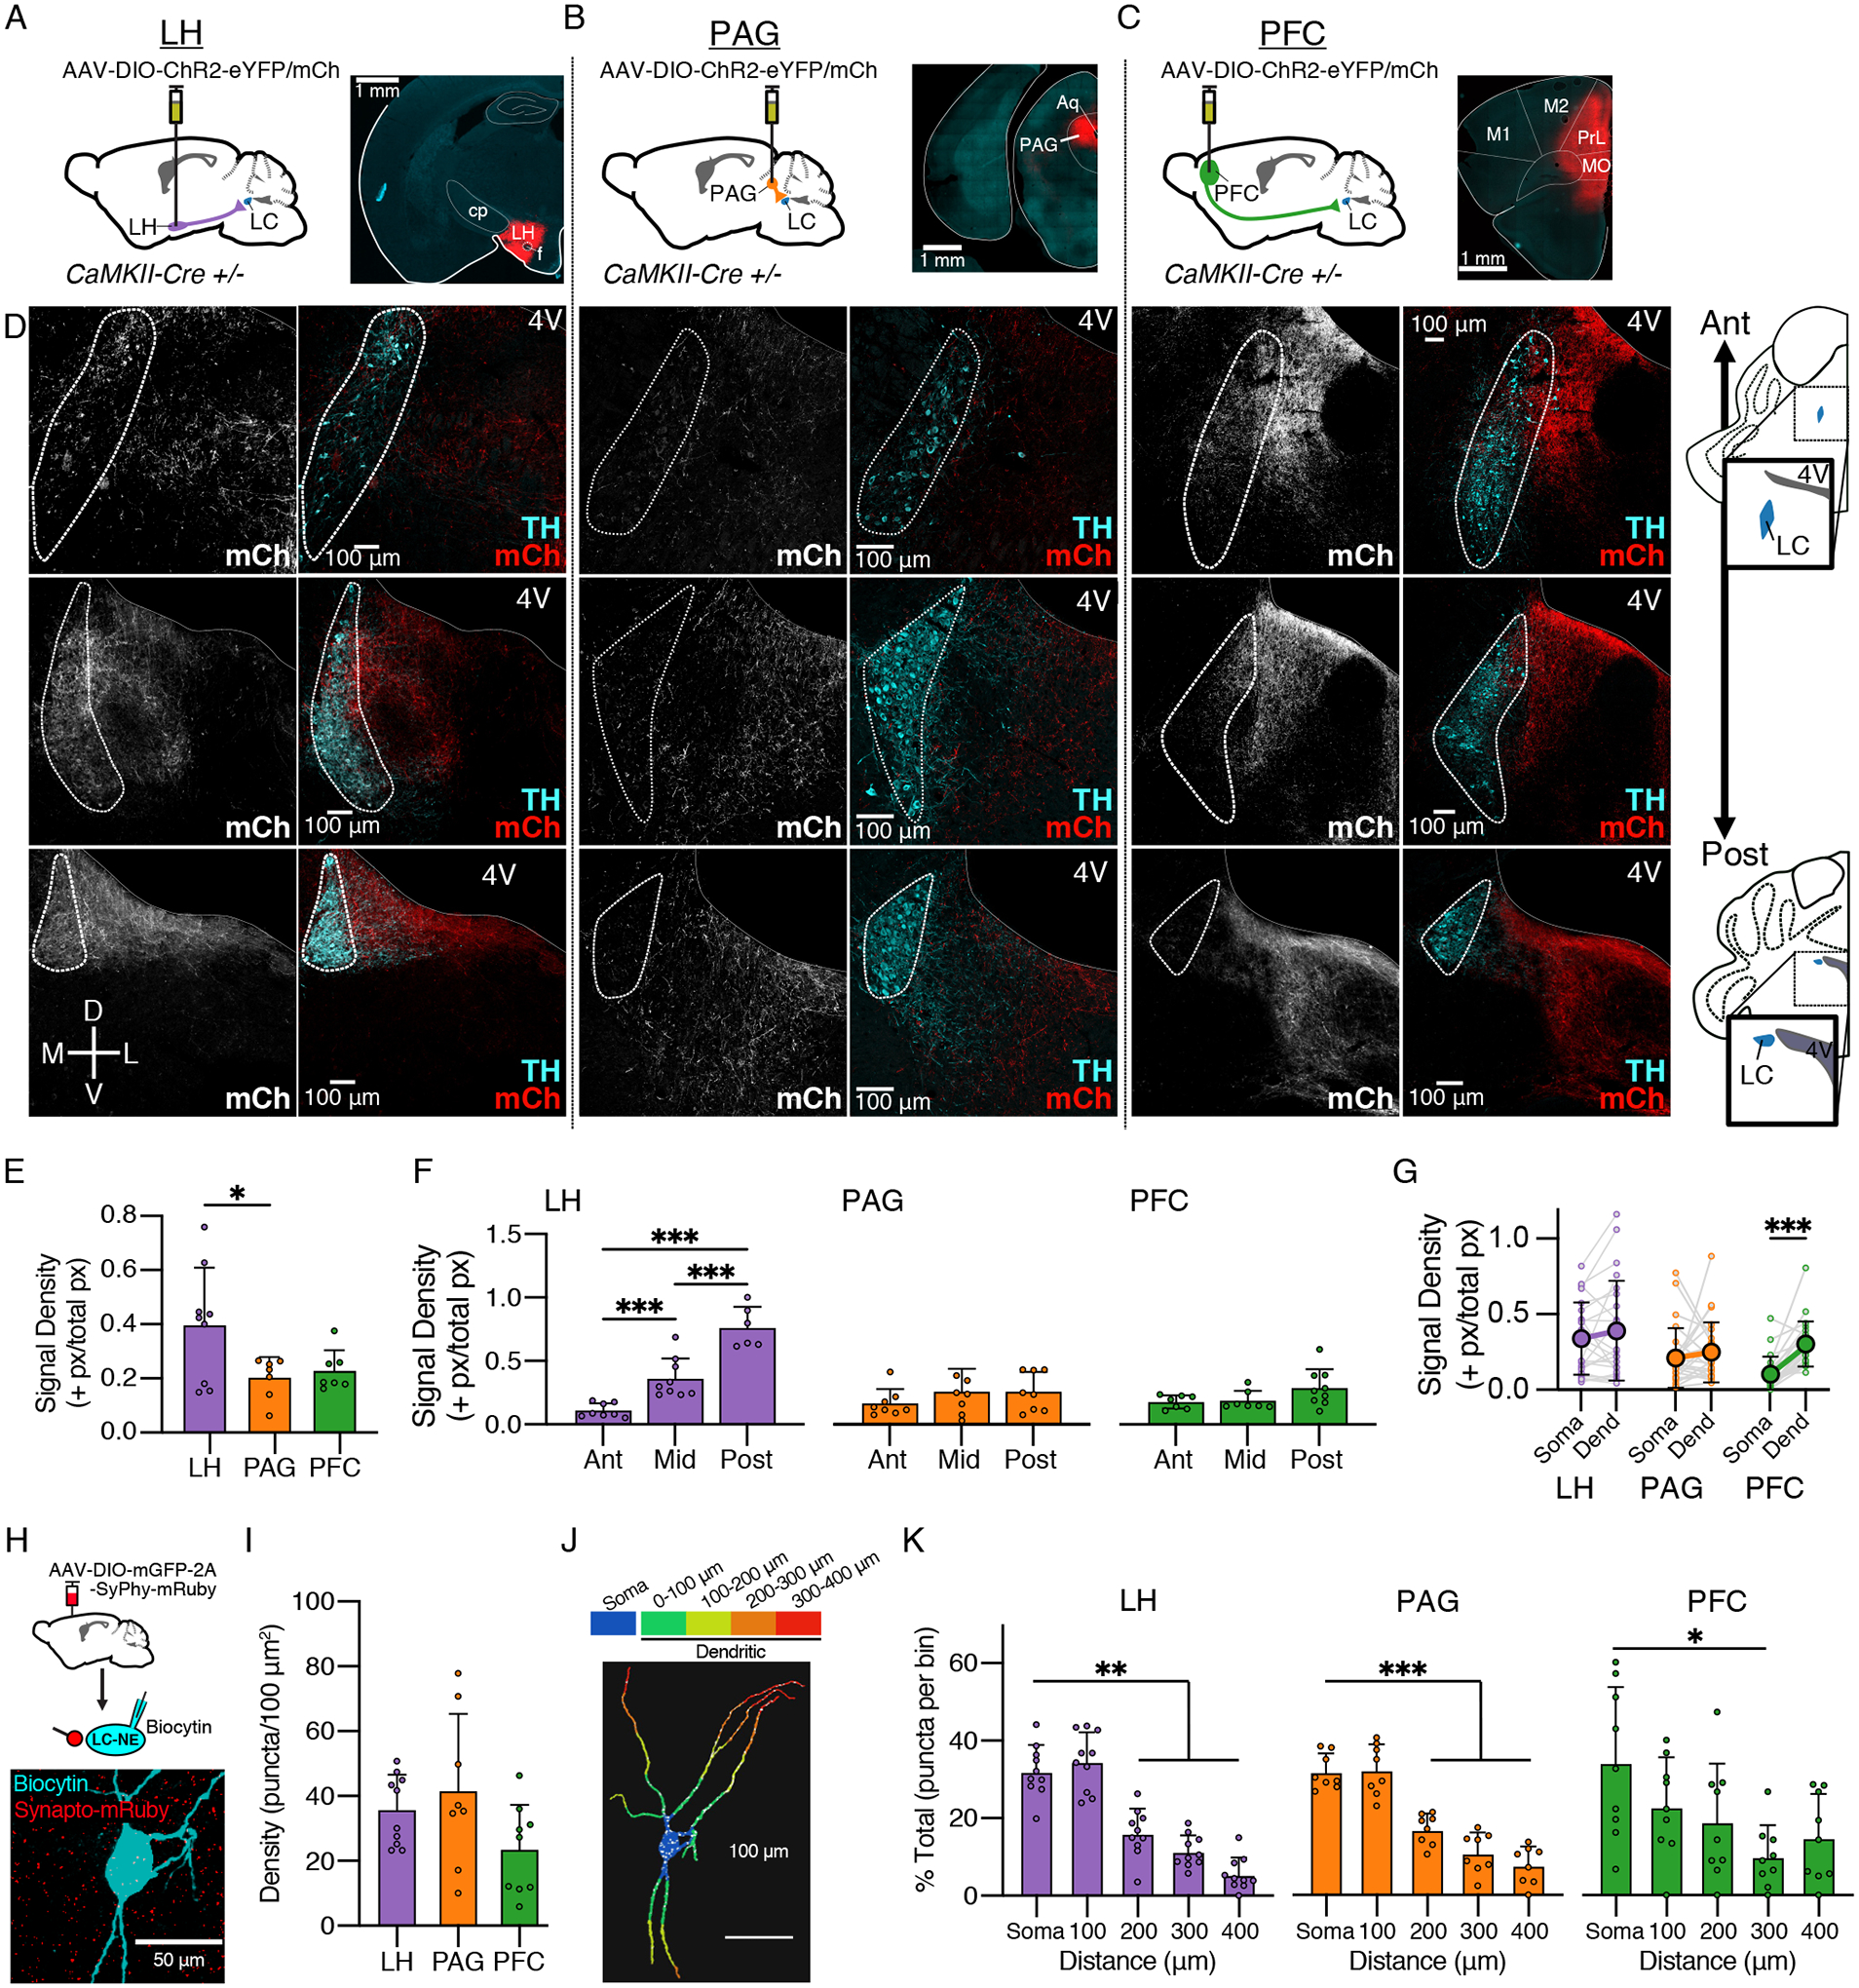
Figure 1. Differential targeting of glutamtergic inputs from the LH, PAG, and PFC to LC neurons.

(A-C) Schematics of viral expression. AAV5-DIO-ChR2-eYFP/mCherry was injected into target sites in CaMKII-Cre+/− mice. Representative images of injection sites are shown for each region. Targeted regions consisted of (A) lateral hypothalamus (LH), (B) lateral periaqueductal grey (PAG), and (C) medial prefrontal cortex (PFC) (cp = caudate putamen, Aq = aqueduct, M1/M2 = motor cortices, PrL = prelimbic cortex, MO = motor orbital cortex).
(D) Representative images of terminal fields of LH (left), PAG (center), and PFC (right) afferents within the LC at anterior (“ant”; top), mid-anteroposterior (middle row), and posterior (“post”; bottom) sections. Gray/red channels show mCh corresponding to viral expression, green channel shows immunostain for TH. (4V = fourth ventricle)
(E) Quantification of the signal density for mCh expressing terminals at the locus coeruleus. The LH afferents (0.40 ± 0.21 +px/px, N = 9) had a higher density than those from the PAG (0.20 ± 0.08 +px/px, N = 7); PFC afferents did not significantly differ (0.23 ± 0.07 +px/px, N = 7) (One-Way ANOVA, F(2,20) = 4.31, p = 0.0277, post hoc Tukey’s test). N = injected hemispheres.
(F) Quantification of the signal density for mCh expressing terminals at 3 anteroposterior (A/P) levels. The density of LH afferents (E) was lowest at the anterior and highest end of the LC (One-Way ANOVA, F(2,22) = 31.77, p < 0.0001, post hoc Tukey’s test). PAG afferents (F) and PFC afferents (G) did not display a significant pattern along the A/P axis. n = images analyzed.
(G) Quantification of the signal density for mCherry+ terminals between the somatic region (TH+ cell bodies) and the dendritic region (medially extending TH+ signal). For PFC inputs (n/N = 24/5), the dendritic region had a greater signal density than the somal (paired t-test, t = 6.84, p < 0.0001). n/N = images analyzed/mice.
(H) CaMKII-Cre+/− mice were injected with AAV-DIO-mGFP-2A-SyPhy-mRuby into LH, PAG, or PFC. Representative image (from LH-injected animal) shows overlap between mRuby+ synaptophysin puncta with a biocytin filled LC-NE cell, labelled with Alexa-647 conjugated streptavidin.
(I) Quantification of puncta density, measured by number of puncta per 100 μm2 cell surface area. No difference was found between LH (n/N = 10/3), PAG (n/N = 8/5), or PFC (n/N = 9/4) terminals (One Way ANOVA, F(2,23) = 2.42, p = 0.11).
(J) 3D reconstruction of a cell fill, displaying distance bins used for analysis; overlapping puncta shown in white. Puncta within the somal region (blue) were compared to those in the dendritic region, which was binned in 100 μm increments.
(K) Quantification of puncta area within each distance bin. mRuby+ terminals were more concentrated in the soma than the dendrites past 100 um from the edge of the soma for afferents from LH (Left; RMANOVA, F(2.82,25.35) = 37.32, p < 0.0001; post-hoc Dunnett’s test comparing each bin to soma) and PAG (Center; RMANOVA, F(2.79,19.51) = 32.87, p < 0.0001; post-hoc Dunnett’s test comparing each bin to soma). Distance from soma was also a significant factor in the distribution of puncta for PFC afferents, though only for a more distal section of the LC dendrites at 300 um from the edge of the soma (Right; RMANOVA, F(2.64,21.15) = 3.23, p = 0.0480). n = filled LC cells.
Summary data are mean ± SD. * = p < 0.05, ** = p < 0.01, *** = p < 0.001.
