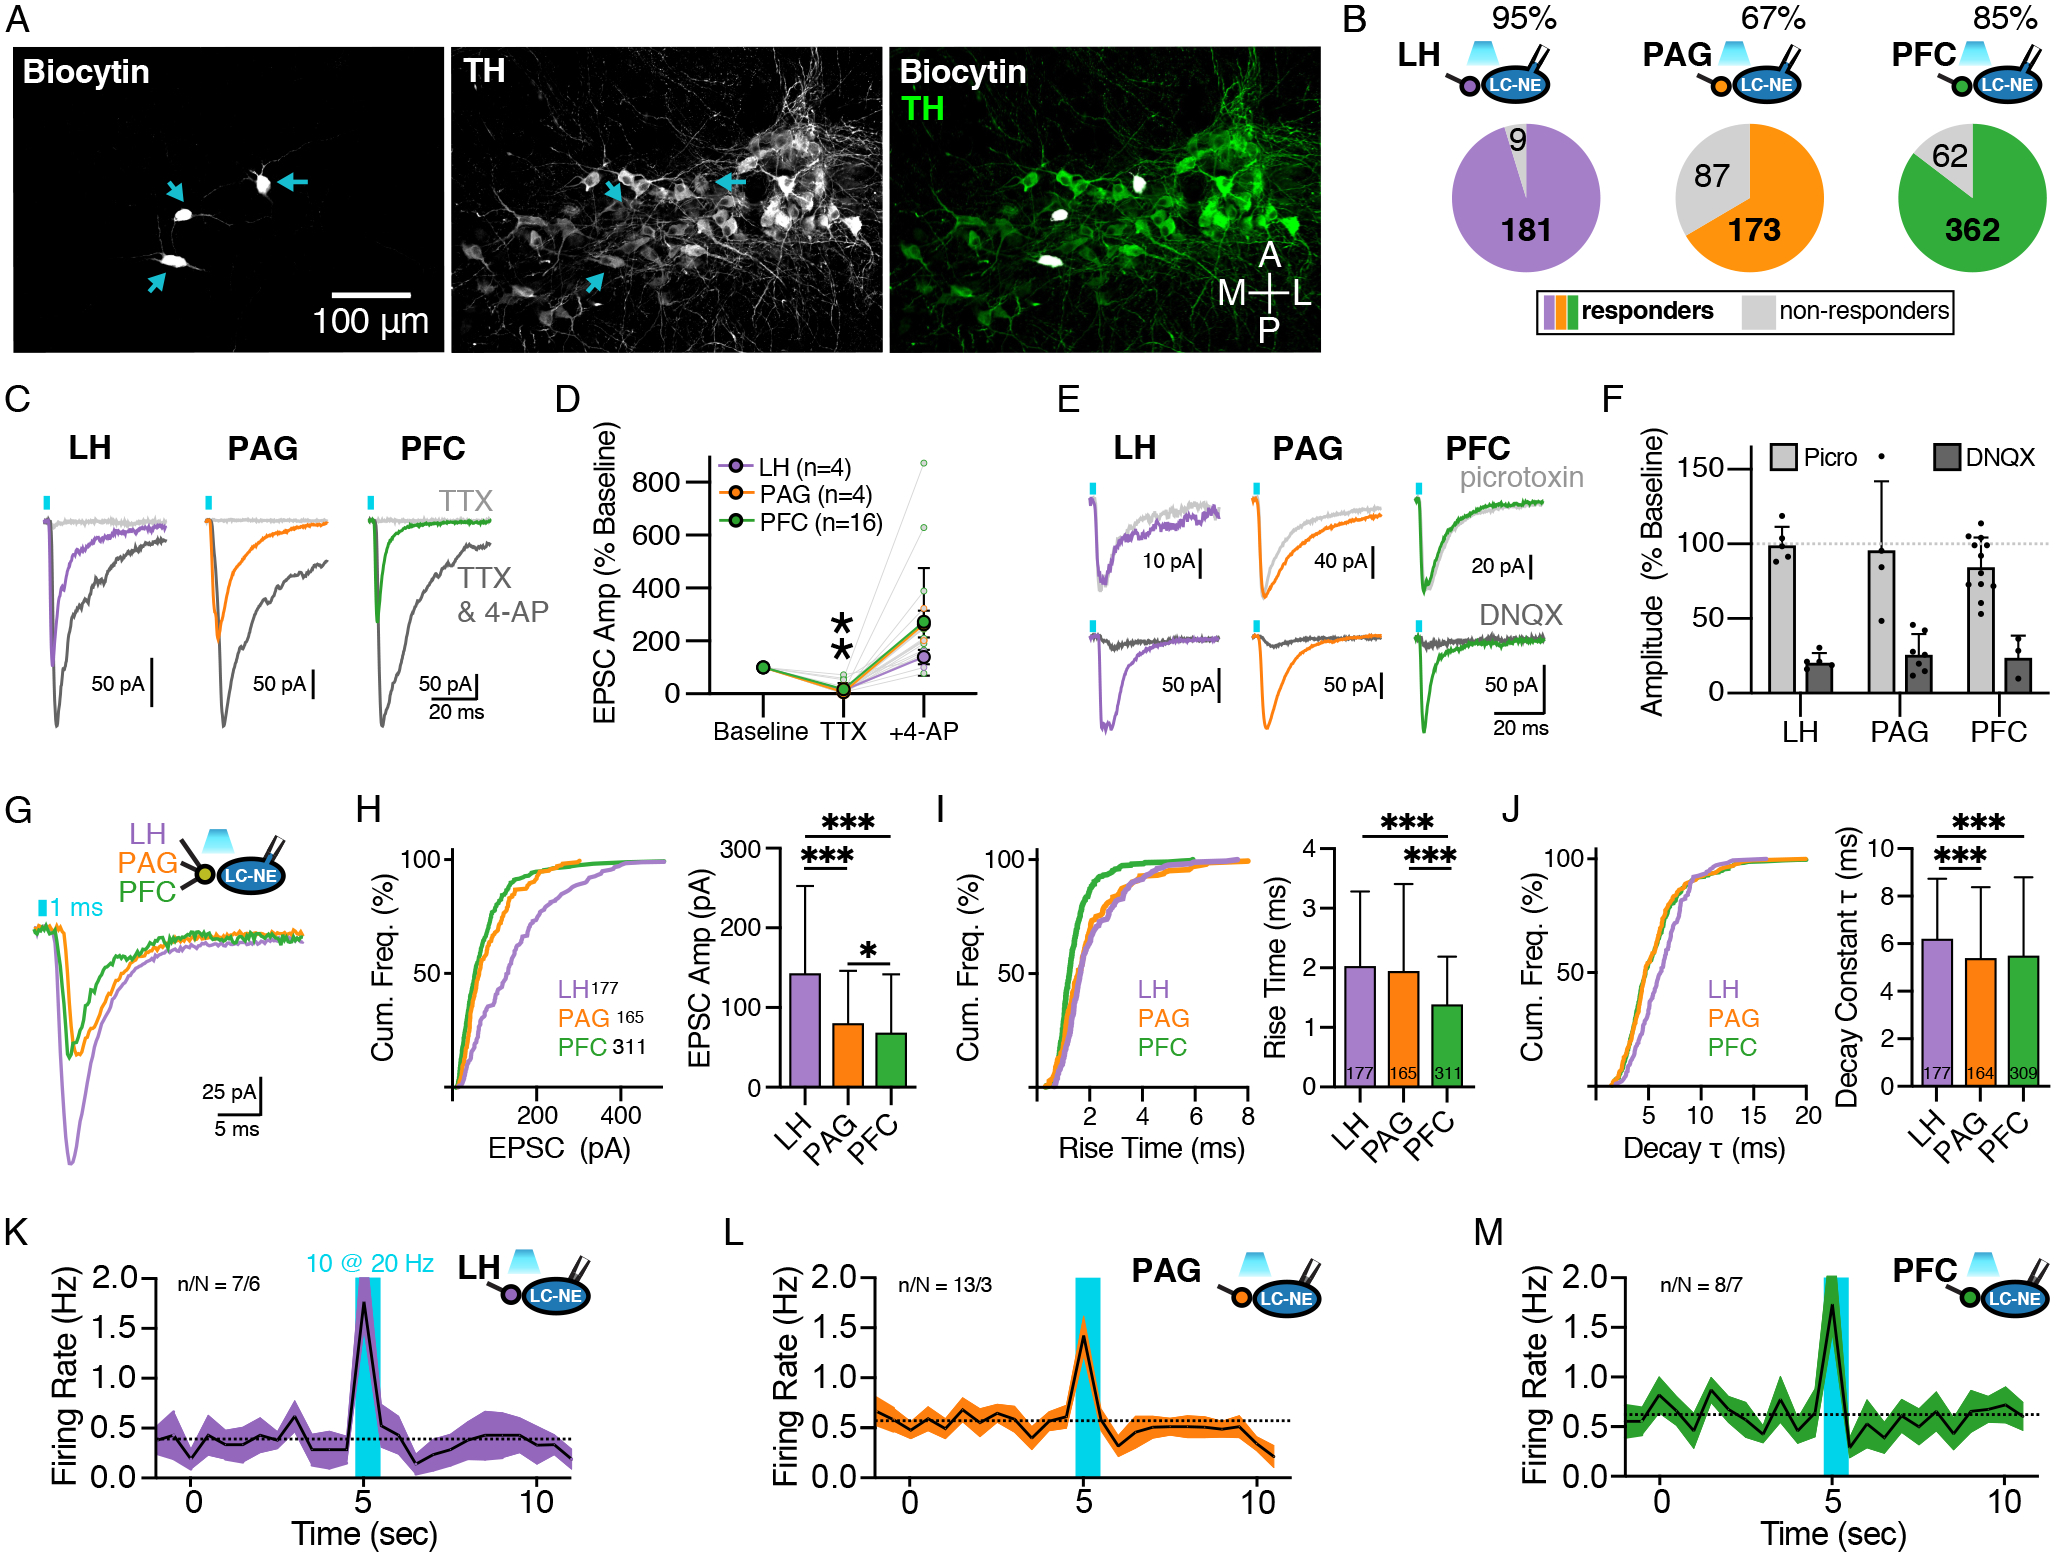
Figure 2. Synaptic properties of glutamatergic afferents from LH, PAG, and PFC to LC-NE neurons differ.

(A) Representative image of recorded LC-NE neurons filled with biocytin (left) and immunostained for TH (center); merged channels shown on right.
(B) Percent connectivity of LH, PAG, and PFC inputs with LC-NE cells. Number in the colored section represents cells with significant response and in the grey section represents cells with no measurable response. At 95% response rate, LH was significantly greater than PAG (67%) and PFC (85%), χ2 = 67.80, p < 0.0001.
(C) Representative traces in control, TTX (1 μM), and TTX + 4-AP (0.5 mM).
(D) Quantification of EPSC amplitude in the presence of TTX and TTX + 4-AP normalized to baseline amplitude for LH (purple), PAG (orange) and PFC (green). Paired t-tests comparing normalized responses between TTX and TTX+4-AP were significant for all afferents such that 4-AP significantly rescued EPSCs.
(E) Representative traces of EPSCs recorded from LC-NE neurons with optogenetic stimulation of each afferent under control conidtions and in the presence of picrotoxin (100 μM) or DNQX (10 μM).
(F) Quantification of EPSC amplitude in the presence of picrotoxin and DNQX normalized to baseline amplitude for each afferent.
(G) Representative traces for optically-evoked EPSCs from LH (purple), PAG (orange) and PFC (green) afferents.
(H) Quantification of EPSC amplitudes as a cumulative frequency distribution (top) and of the mean ± SEM (bottom). Kruskal-Wallis ANOVA with posthoc Dunn’s test, H(2) = 88.36, p < 0.0001; ***LH vs. PAG p < 0.0001, ***LH vs. PFC p < 0.0001, *PAG vs. PFC p = 0.044.
(I) Quantification of EPSC rise times as a cumulative frequency distribution (top) and of the mean ± SEM (bottom). Kruskal-Wallis ANOVA with posthoc Dunn’s test, H(2) = 52.96, p < 0.0001; LH vs. PAG p = 0.3, ***LH vs. PFC p < 0.0001, ***PAG vs. PFC p = 0.0244.
(J) Quantification of EPSC decay constants as a cumulative frequency distribution (top) and of the mean ± SEM (bottom). Kruskal-Wallis ANOVA with posthoc Dunn’s test, H(2) = 22.54, p < 0.0001; ***LH vs. PAG p = 0.0003, ***LH vs. PFC p < 0.0001, PAG vs. PFC p > 0.99.
(K-M) Firing rates of LC-NE neurons following optogenetic stimulation of LH, PAG or PFC afferents (20 Hz; 1 ms pulse; 0.5 sec duration; cell attached recordings) (K) Activation of ChR2 in LH afferents, n/N = 7/6. (L) Activation of ChR2 in PAG afferents, n/N = 13.3. (M) Activation of ChR2 in PFC afferents, n/N = 8/7.
Summary data are mean ± SD. * = p < 0.05, *** = p < 0.001.
