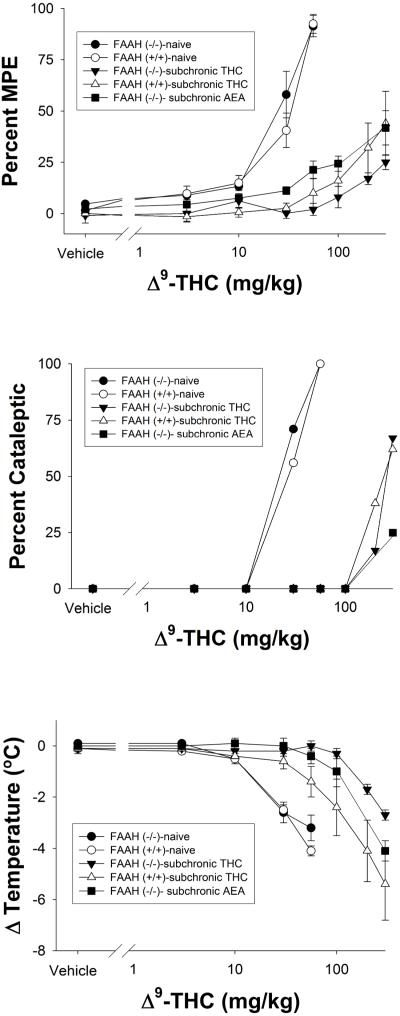
Figure 2.
Cumulative dose-response curves of THC in FAAH−/− or FAAH+/+ mice that were treated subchronically with either THC or AEA. Also included for comparison were naïve FAAH−/− or FAAH+/+ mice (data also presented in Figure 1). Subjects were evaluated in the tail immersion test for antinociception (top panel), bar test for catalepsy (center panel), or hypothermia (bottom panel). Data are presented as mean ± SEM, n= 6-8 mice/condition.

