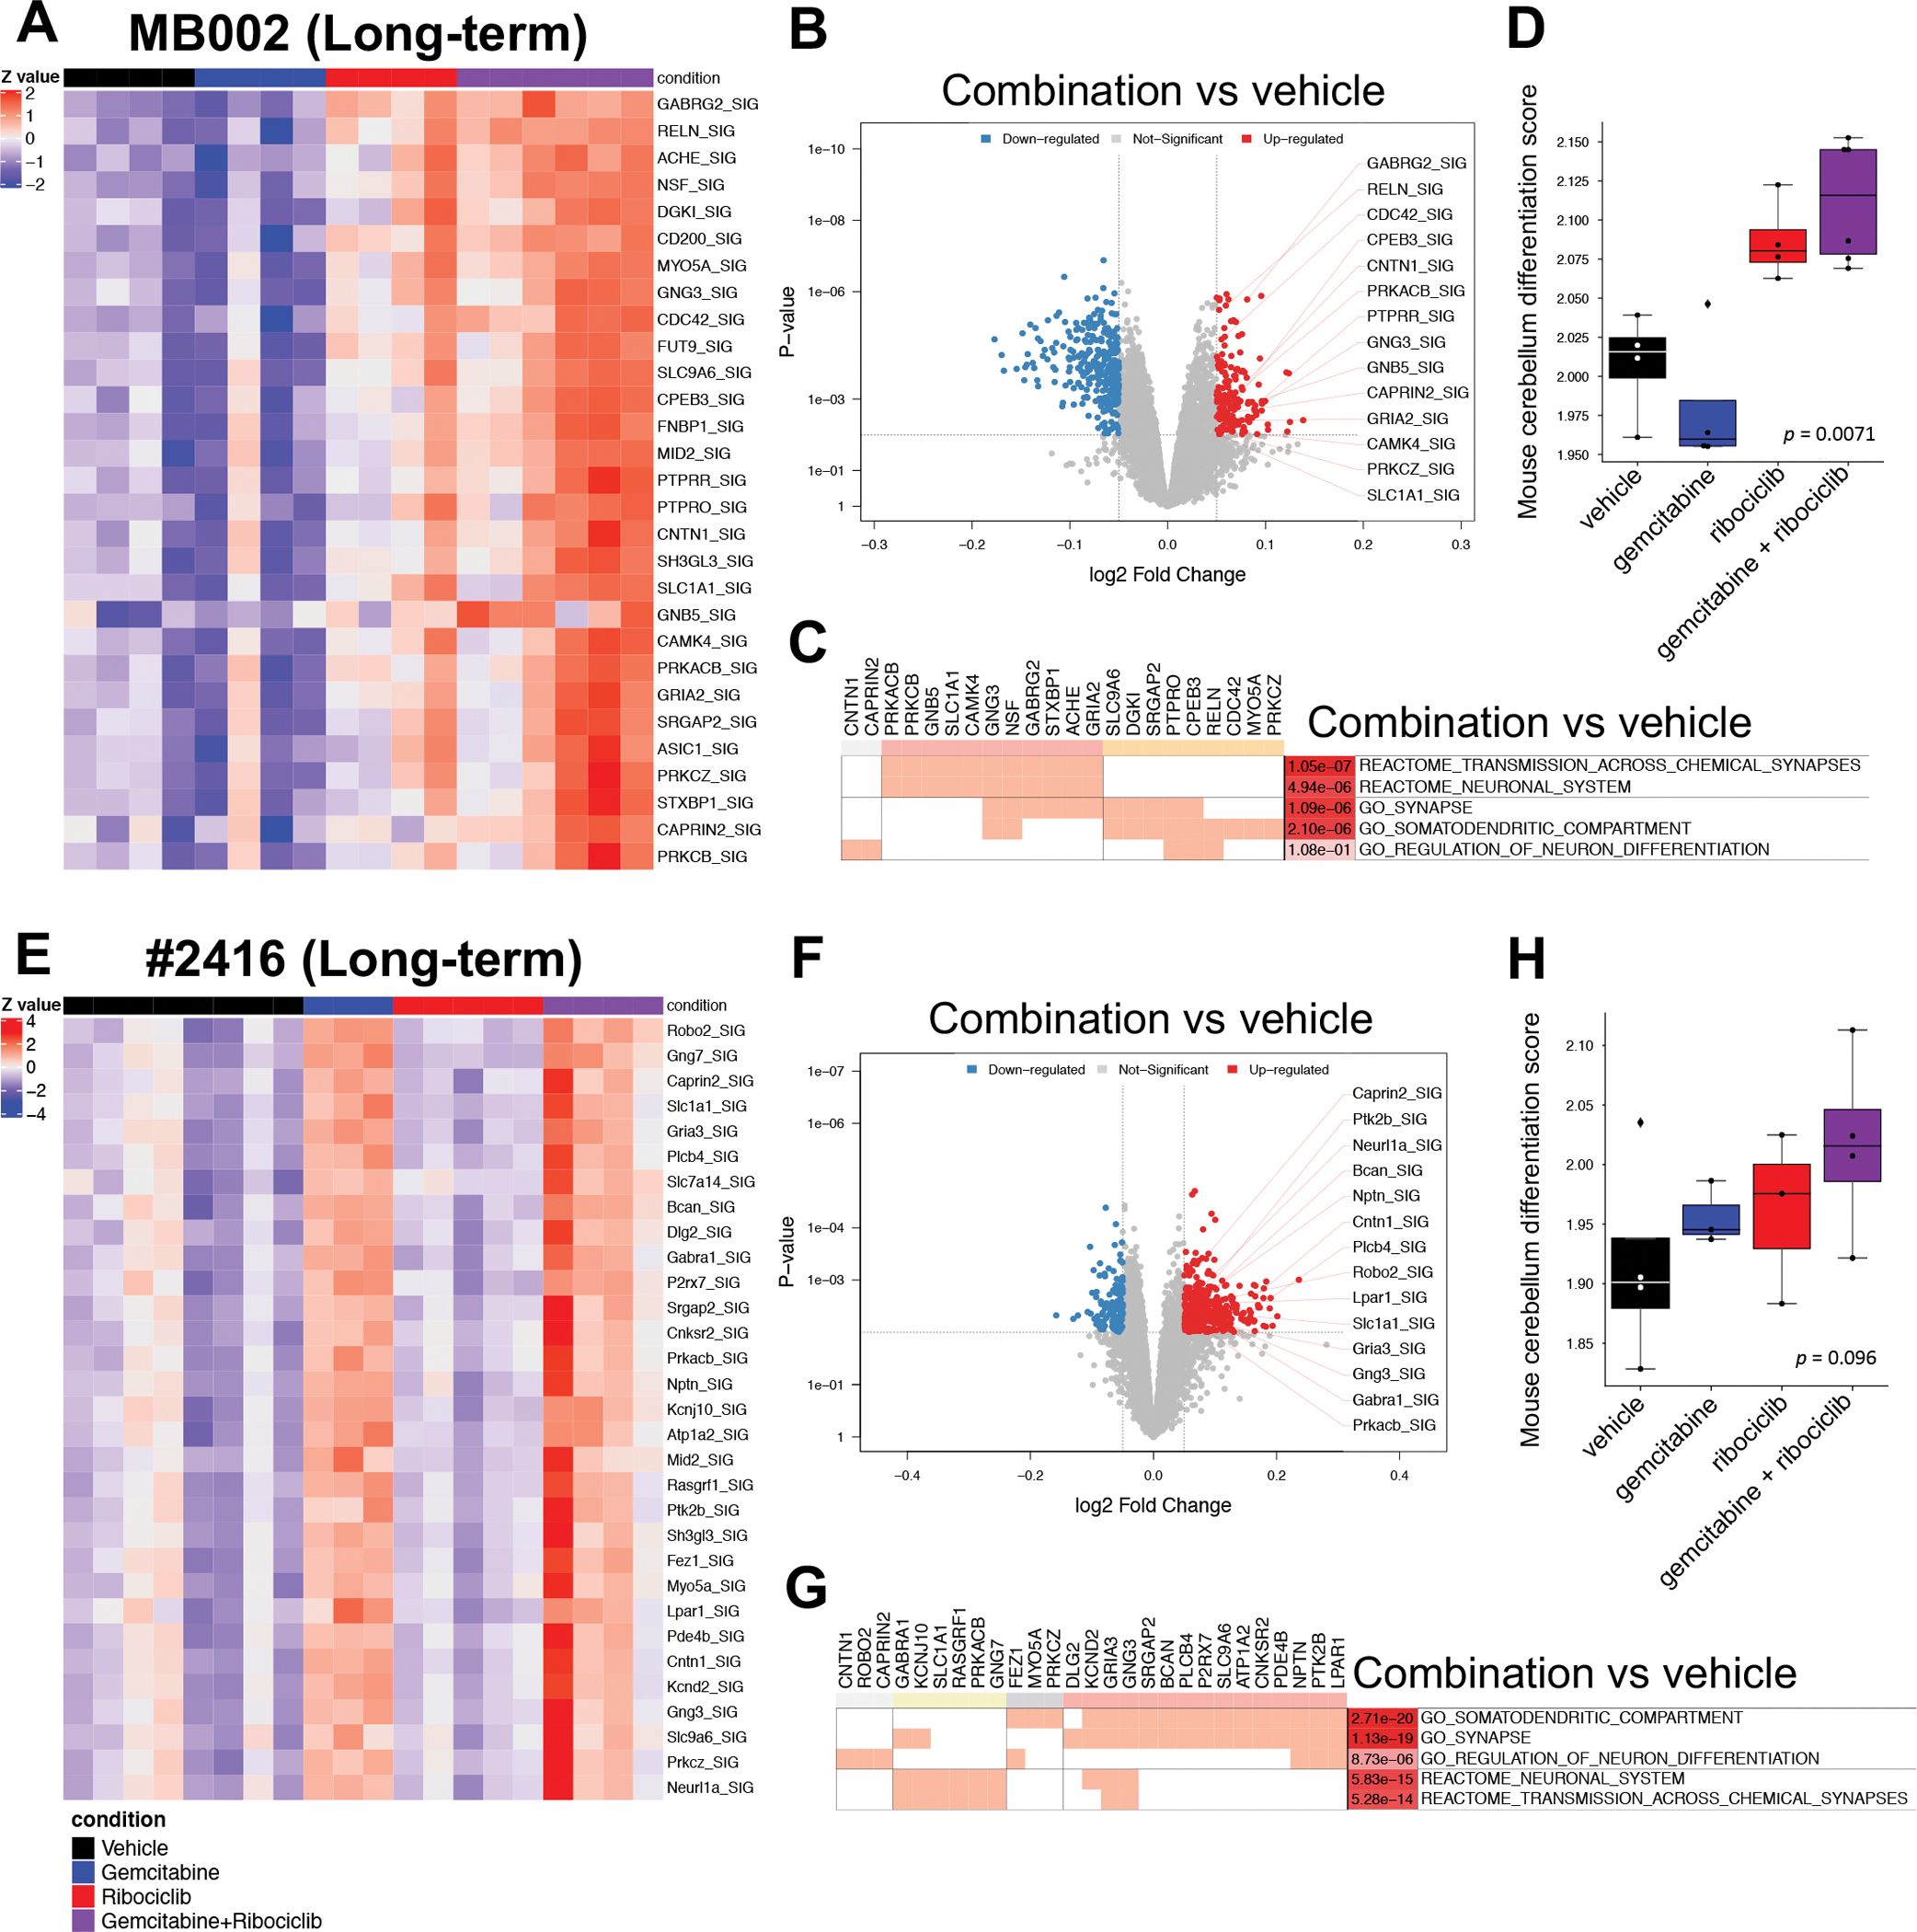
Figure 4: Long-term combination of ribociclib and gemcitabine increases the activity of genes involved in neuronal identity in G3MB.

NetBID analysis and differentiation score of tumors from mice bearing PDOX MB002 (A-D) or mouse tumor #2416 (E-H) treated with vehicle (black bar), gemcitabine (blue bar), ribociclib (red bar), and gemcitabine and ribociclib (combination) (purple line). (A, E) Activity heatmaps of a selection of genes from tumors for each treatment group. (B, F) Volcano plots showing genes with differential activity in tumors treated with gemcitabine and ribociclib combination versus vehicle (network size > 25; p < 0.01 and logFC < −0.05 or logFC > 0.05). (C, G) Clustering of genes in up-regulated pathways. (D, H) Differentiation scores for tumors for each treatment group computed from a single-cell RNA-seq dataset from the developing mouse cerebellum (Mann-Whitney test, gemcitabine + ribociclib versus vehicle).
