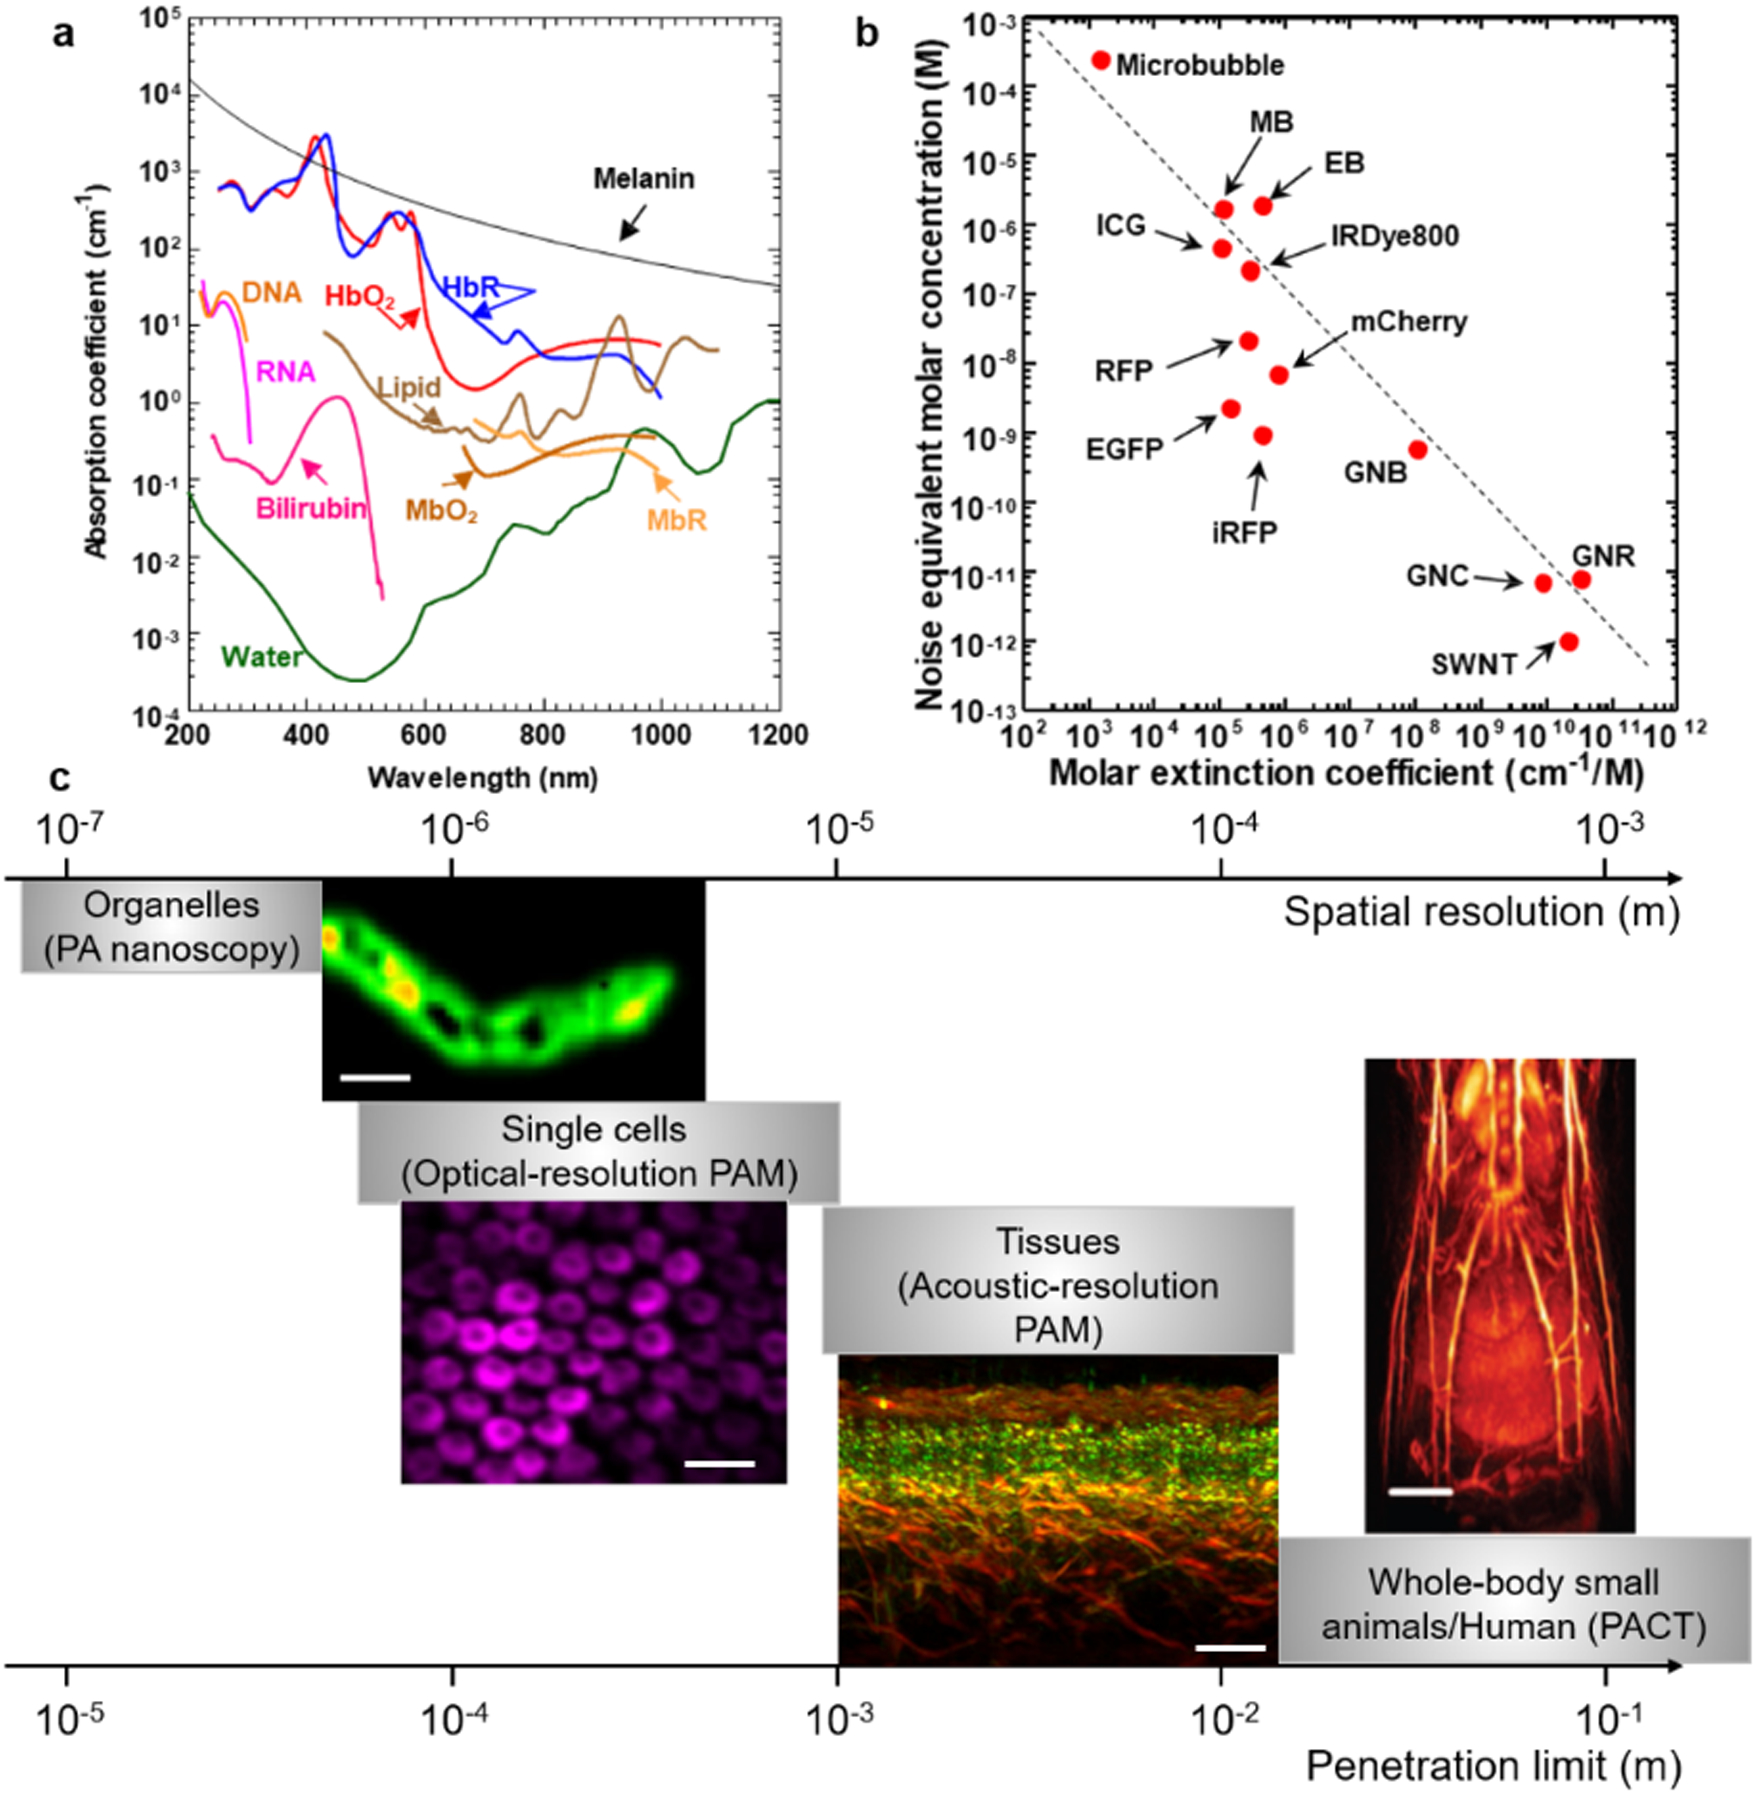
Figure 2.

Multicontrast and multiscale PAT. (a) Absorption spectra of endogenous molecules at normal concentrations in vivo.27 Bilirubin, 12 mg L−1 in blood; DNA/RNA, 1 g L−1 in cell nuclei; HbO2, Oxy-hemoglobin, HbR, deoxy-hemoglobin, 2.3 mM in blood; MbO2, oxy-myoglobin, MbR, reduced myoglobin, 0.5% mass concentration in skeletal muscle; melanin, 14.3 g L−1 in skin; lipid, 20% volume concentration in tissue; water, 80% volume concentration in tissue. (b) Noise equivalent molar concentrations of some widely used exogenous contrast agents, based on reported values form literature.27 Illumination fluence is not compensated. EB, evens blue45; EGFP, enhanced green fluorescent protein46; GNB, gold nanobeacon47; GNC, gold nanocage48; GNR, gold nanorod49; ICG, indocyanine green50; IRDye800, near-infrared Dye80051; iRFP, near-infrared red fluorescent protein52; MB, methylene blue53; mCherry, monomeric cherry protein46; Microbubble54; RFP, red fluorescent protein52; SWNT, single-walled nanotube55. The dashed curve is power function fitting y = 0.1x−1, where y is the noise equivalent concentration in molars, x the molar extinction coefficient in cm−1 M−1. (c) Multiscale PAT and representative images. Organelles, PA nanoscopy of a single mitochondrion, scale bar, 500 nm.37 Single cells, optical-resolution PAM of red blood cells, scale bar, 20 μm.38 Tissues, acoustic-resolution PAM of human skin, scale bar, 500 μm.25 Wholebody small animals, wholebody PACT of a nude mouse in vivo, scale bar, 4 mm.39
