Figure 6.

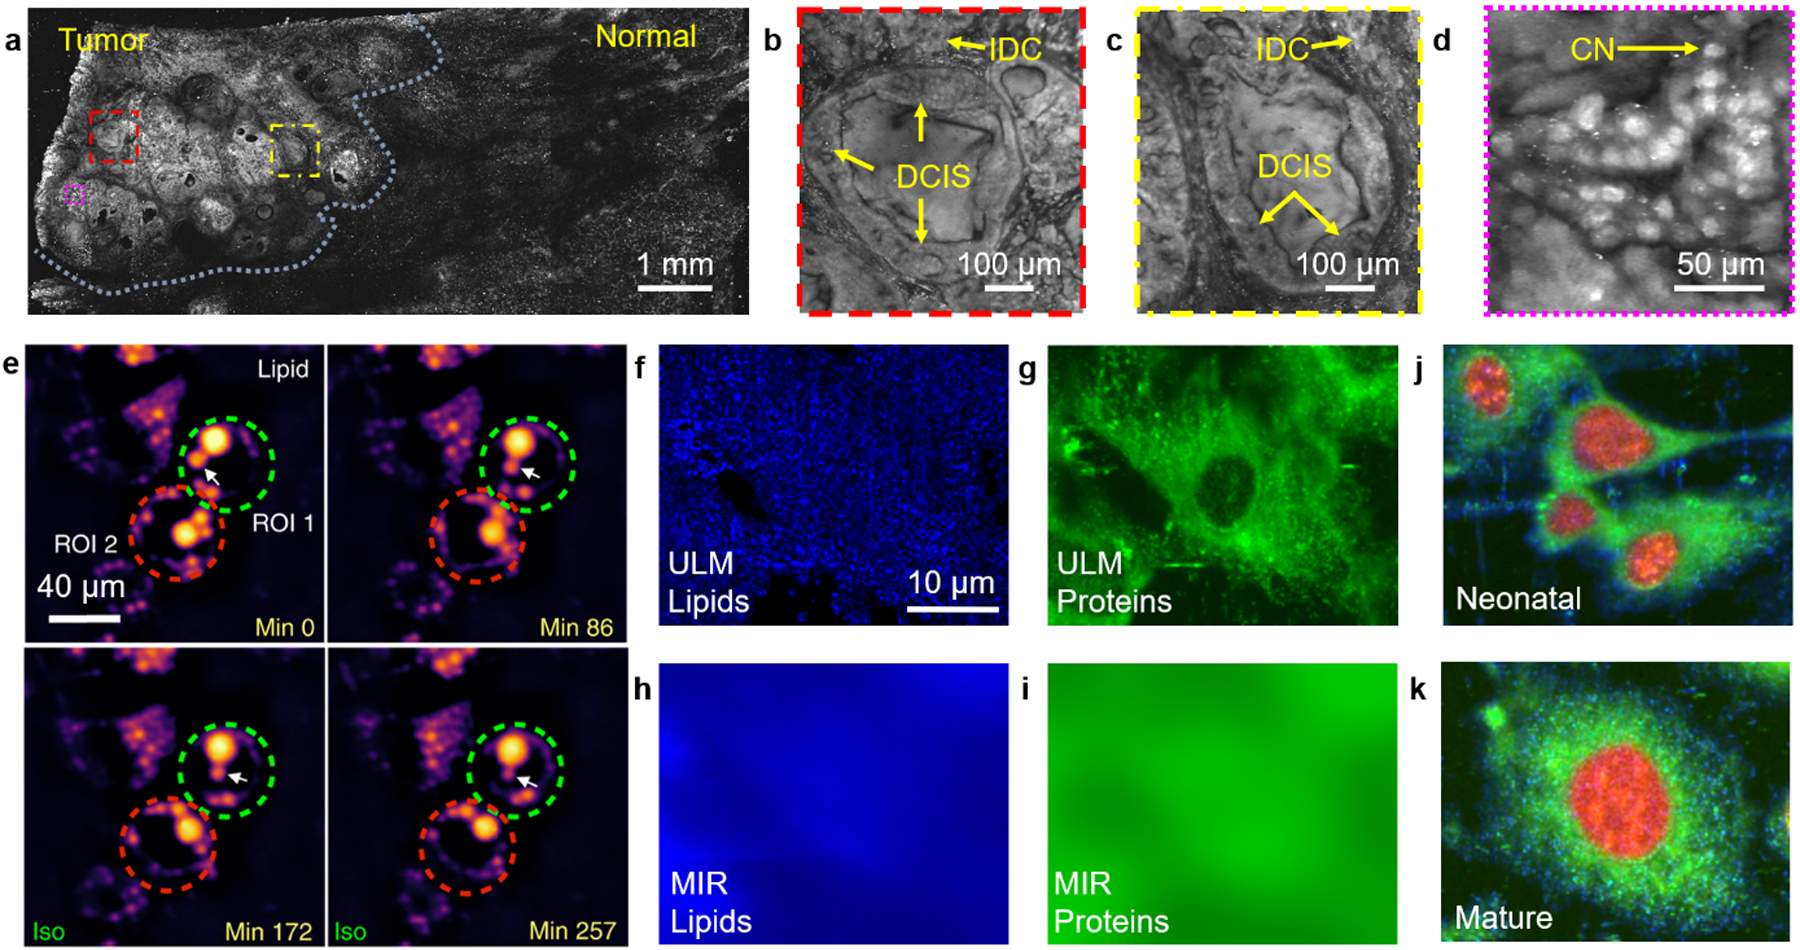
Broad-spectrum PAM of tissues and cells. (a) PAM image of a fixed, unprocessed breast tumor. Illumination wavelength, 266 nm.89 (b–d) Zoomed-in PAM images of the red, yellow, and magenta dashed regions in (a), respectively. IDC, invasive ductal carcinoma; DCIS, ductal carcinoma in situ; CN, cell nuclei.89 (e) Monitoring intrinsic lipid contrast during lipolysis in differentiated 3T3-L1 adipocytes at 2,857 cm−1. Two regions of interest (ROIs) enclosing individual adipocytes are marked; green dashed circle for ROI 1 and red dashed circle for ROI 2. The white arrow follows the process of lipid droplet remodeling in a single adipocyte enclosed in ROI 1.92 (f, g) ULM-PAM images of lipids (f) and proteins (g).86 (h, i) MIR-PAM images of lipids (h) and proteins (i), imaged at 3,420 nm and 6,050 nm, respectively.86 (j, k) Composite images of cells formed by overlaying the images of lipids (blue), proteins (green), and nucleic acids (red) in different color channels at neonatal (j) and mature (k) stages86.
