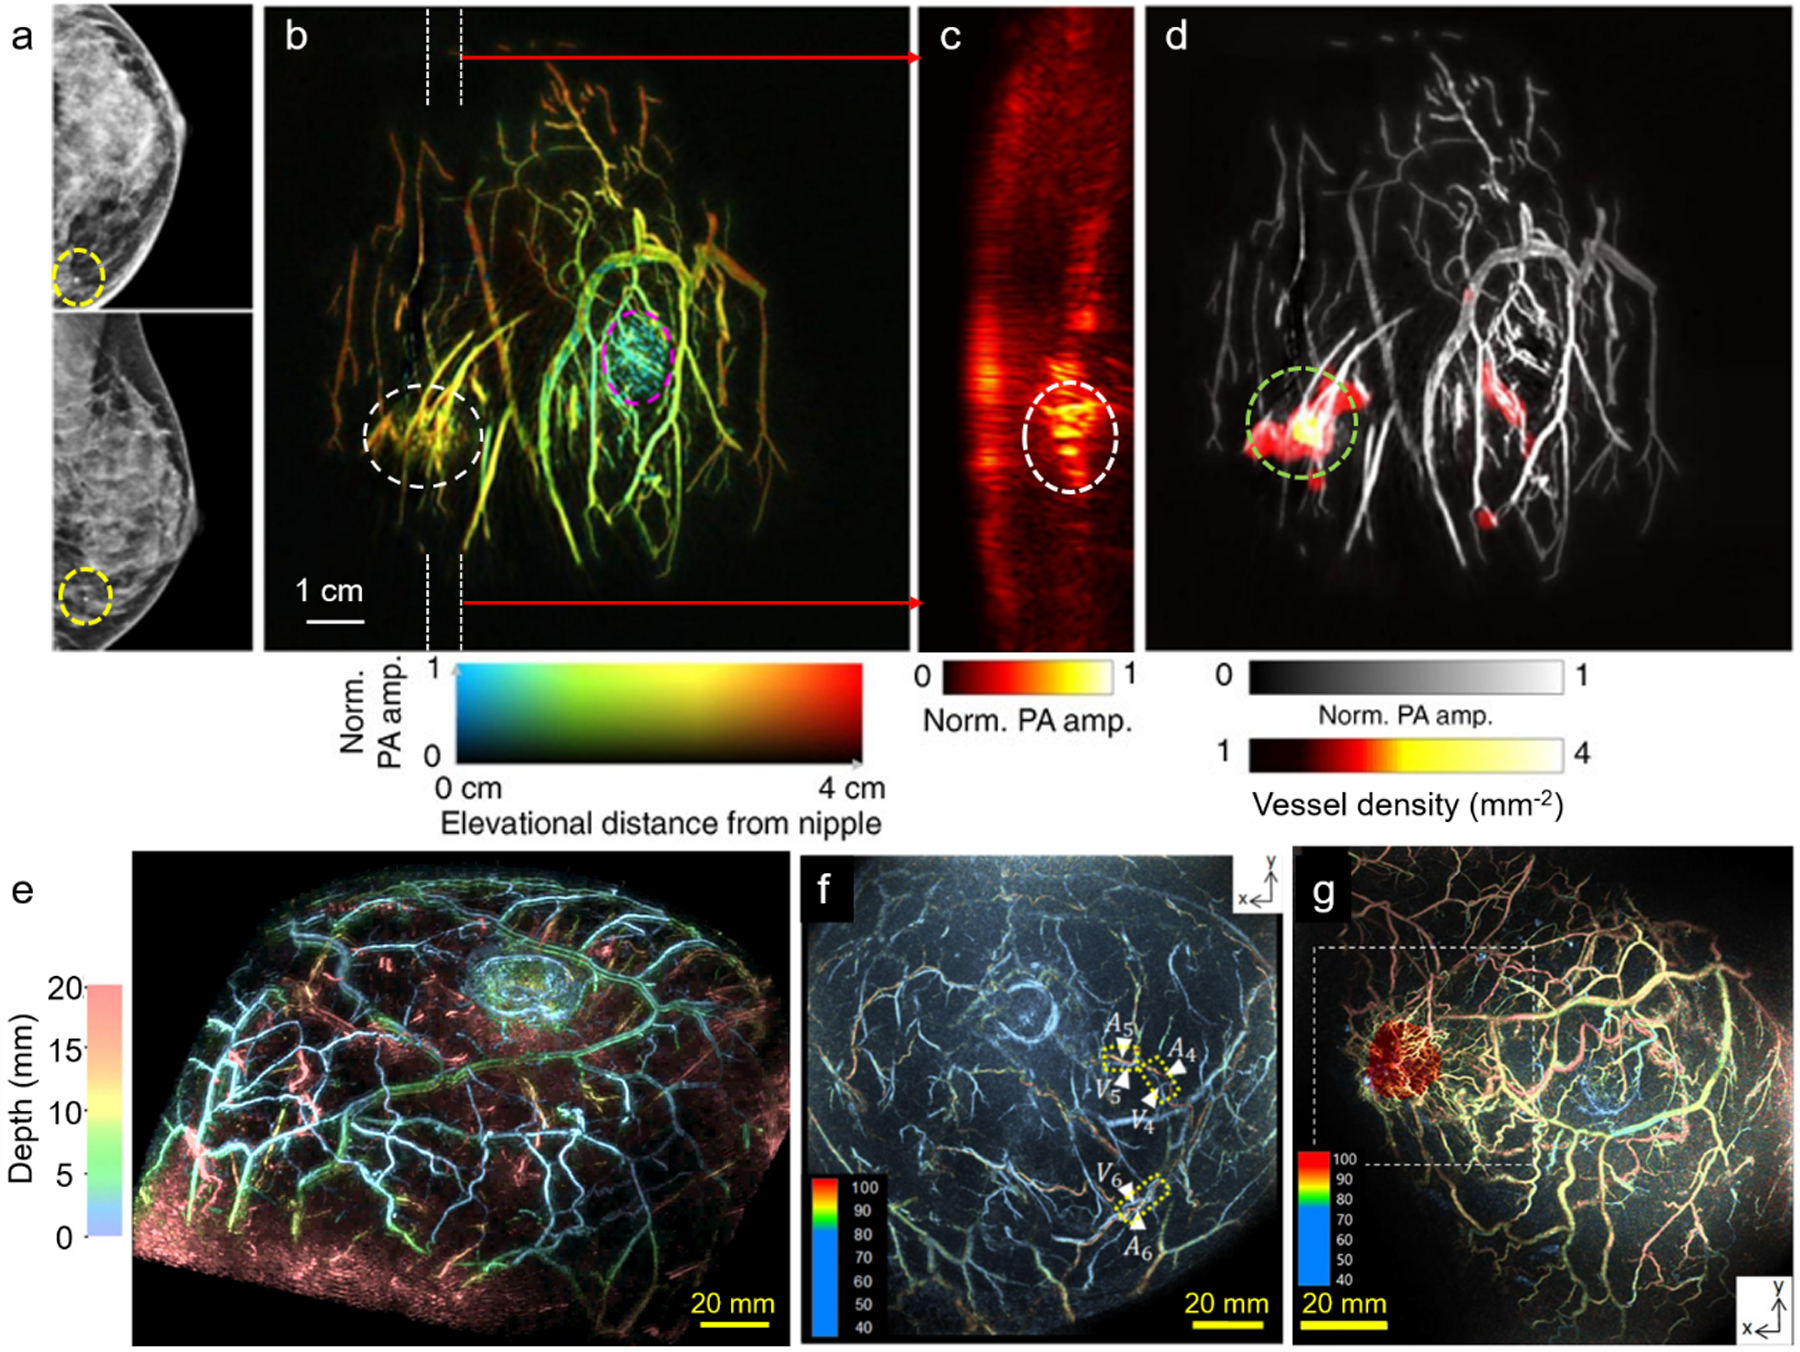
Figure 7.

PACT of human breasts. (a) X-ray mammograms of an affected breast.95 (b) Depth-encoded angiogram of the affected breast acquired by SBH-PACT. The breast tumor is identified by a white circle, the nipple is marked by a magenta circle.95 (c) Maximum amplitude projection (MAP) images of the thick slice in sagittal planes marked by white dashed lines in (b).95 (d) Automatic tumor detection on vessel density maps. Tumors are identified by green circles. Background images in gray scale are the MAP of vessels deeper than the nipple.95 (e) Depth-encoded 3D PACT image of a healthy breast.96 (f) Evaluation of the S-factor in a healthy breast, where the color represents the measured S-factor.97 (g) A fusion image of the S-factor and 3D-US images (red color).97
