
Figure 2. DSG2-W2A mutant mice develop characteristics of ACM.
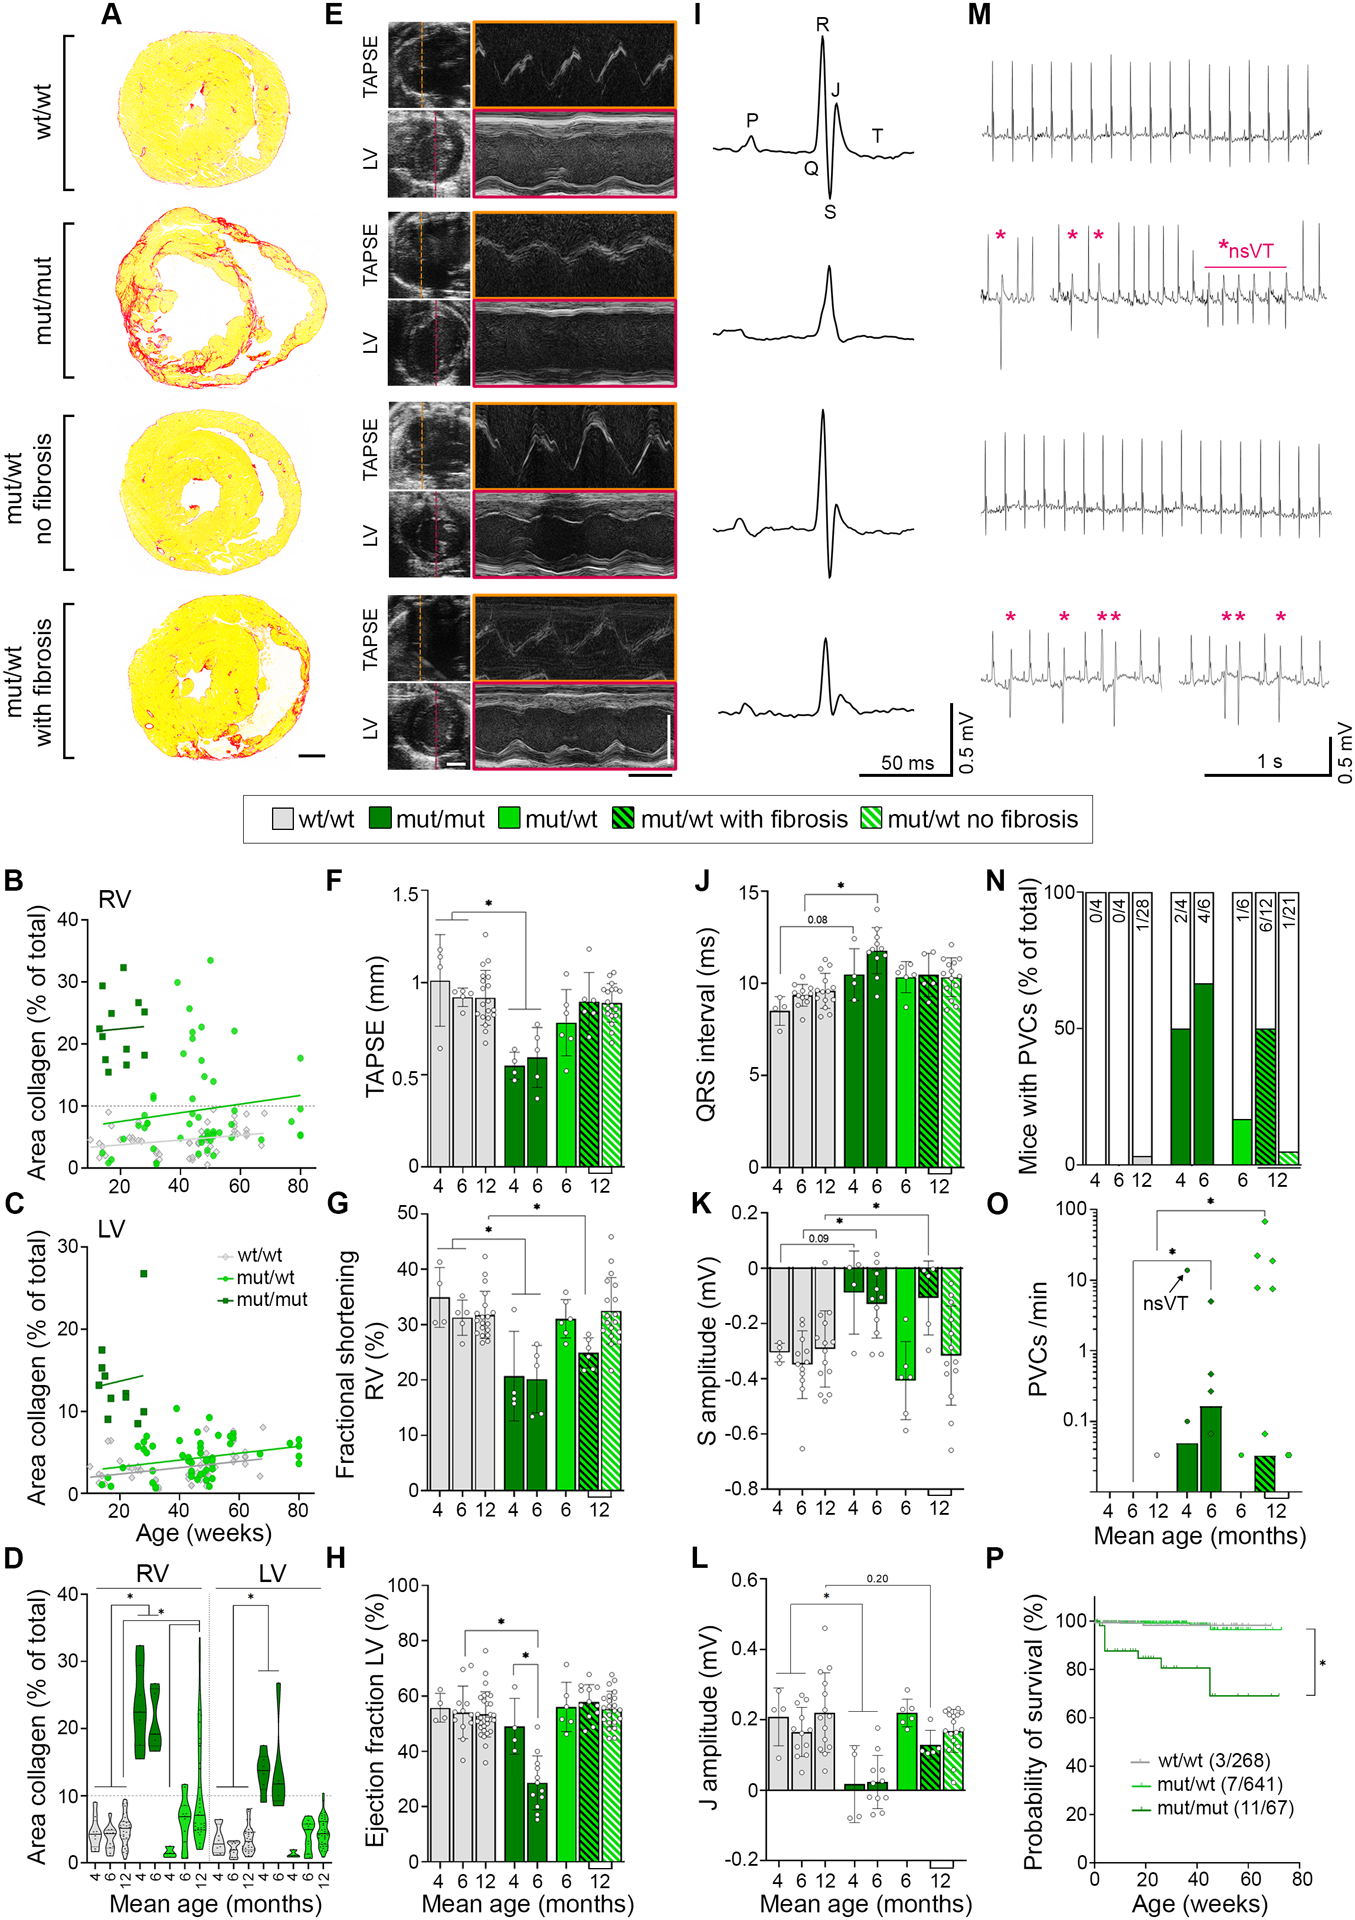
(A) Cardiac fibrosis detected by picrosirius red collagen staining with representative images of sections from 6-months old DSG2-W2A mut/mut and 12-months old wt/wt and mut/wt animals. Scale bar = 1 mm. (B - D) Corresponding analysis of the area of collagen in the right (RV) and left ventricle (LV). Continuous lines indicate the simple linear regression between age and area of collagen. Hearts with more than 10% of collagen in the RV (grey dotted line) were defined as “with fibrosis”. Each dot represents one animal. *P< 0.05, mixed effects analysis with LV and RV matched per animal, Sidak’s post hoc test. Lines indicate median and quartile values. (E) Representative echocardiography images for measurements of the tricuspid annular plane systolic excursion (TAPSE) and LV function in 6-months old mut/mut and 12-months old wt/wt and mut/wt animals. Left side: 2D images from apical four chamber view for TAPSE and parasternal short axis view for LV. M-mode tracings on the right were performed along the line indicated on the left. Scale bars: white 2 mm; black 100 ms. Corresponding analysis of (F) TAPSE, *P< 0.05, Kruskal-Wallis test with Dunn’s post hoc test, (G) fractional shortening of the RV, *P< 0.05, Kruskal-Wallis test with Dunn’s post hoc test, and (H) ejection fraction of the LV, *P< 0.05, one-way ANOVA, Sidak’s post hoc test. (I) Electrocardiogram (ECG) recoded in lead II with representative curves from 6-months old mut/mut and 12-months old wt/wt and mut/wt animals. Definition of respective peaks is indicated in the wt/wt curve. Scale bars: vertical 0.5 mV; horizontal 50 ms. Corresponding analysis of (J) QRS interval, *P< 0.05 or as indicated, Kruskal-Wallis test with Dunn’s post hoc test, (K) amplitude of the S peak, *P< 0.05 or as indicated, one-way ANOVA, Sidak’s post hoc test, and (L) amplitude of the J peak (early repolarization), *P< 0.05 or as indicated, Kruskal-Wallis test with Dunn’s post hoc test. (M) Ventricular arrythmia detected by ECG during 30 min of baseline measurements with example curves from 6-months old mut/mut and 12-months old wt/wt and mut/wt animals. Asterisks mark premature ventricular contractions (PVC), *nsVT indicates a non-sustained ventricular tachycardia detected in one mut/mut animal. Scale bars: vertical 0.5 mV; horizontal 1 s. Corresponding analysis of (N) percentage of mice presenting with PVCs. Values in bars indicate corresponding absolute number of mice with PVC (colored bars) compared to total number of mice evaluated (empty bar), and (O) PVC burden depicted as number of PVCs per minute, *P< 0.05, Kruskal-Wallis test with Dunn’s post hoc test. The black arrow indicates the animal presenting with non-sustained ventricular tachycardia. (P) Kaplan-Meier survival plot of DSG2-W2A mice from an analysis period of 3 years. Vertical lines indicate drop-outs due to unrelated elimination (end of experiment, breeding, injuries). Values indicate corresponding absolute number of mice with sudden death compared to total number of mice evaluated. *P< 0.05, Gehan-Breslow-Wilcoxon test. Box with color indications of respective groups in the middle apply to the entire figure.