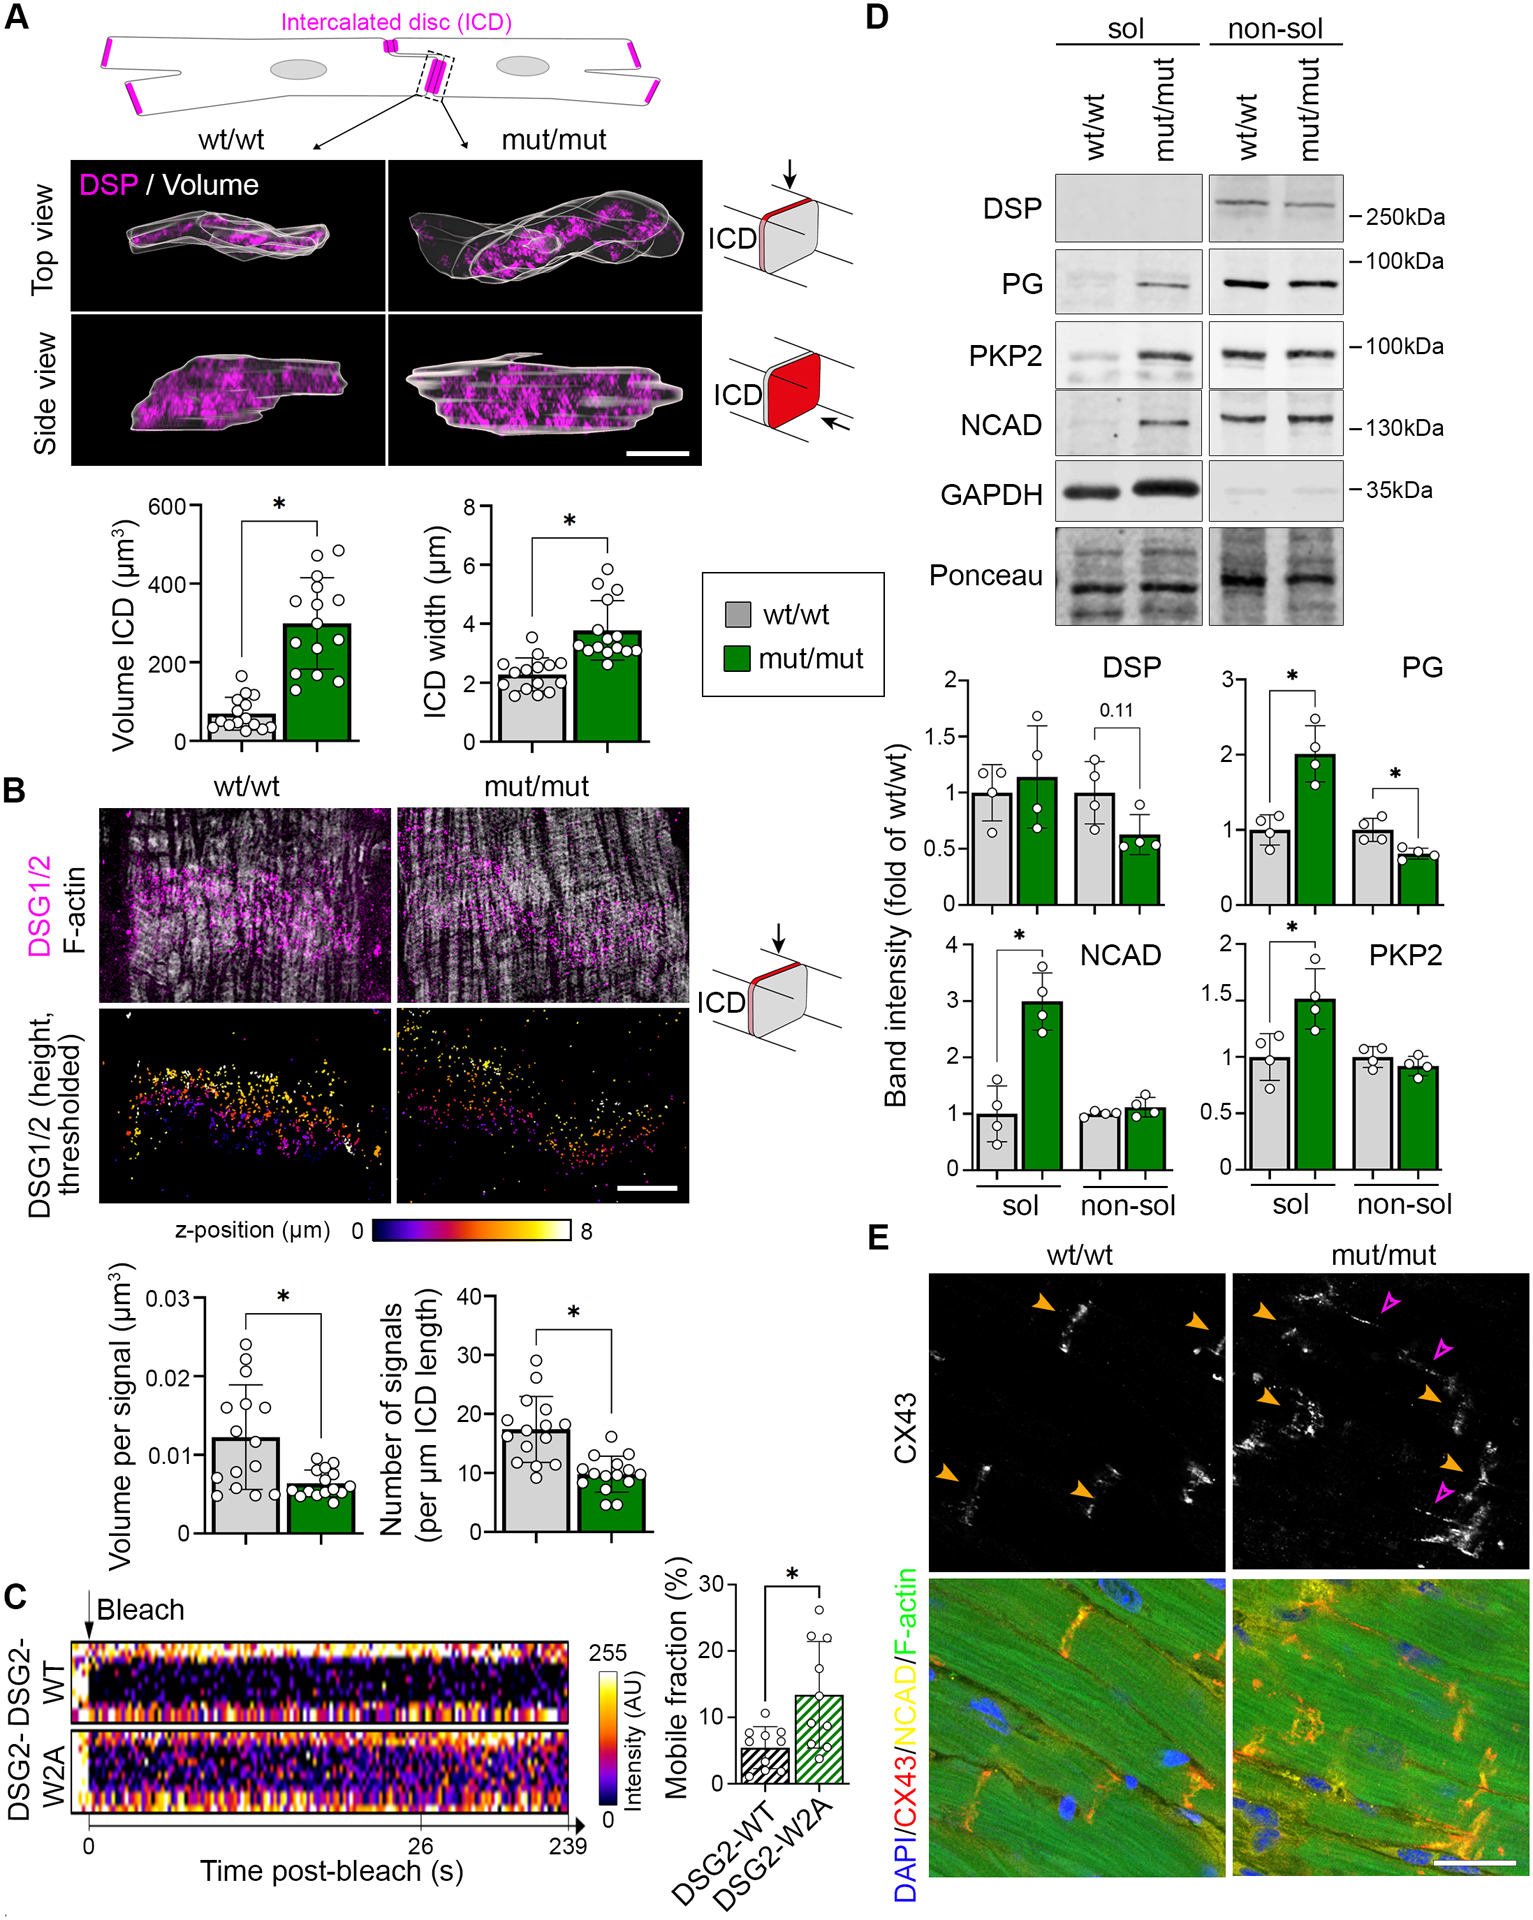
Figure 4. Disrupted ICD structure in DSG2-W2A mutant mice.

(A) Representative z-stack reconstruction of segmented ICDs in top and side view acquired with SIM. Overlay of analysed ICD volume is shown in grey. ICDs are marked by DSP (magenta). Scheme on top presents segmented area and pictograms on the right display the respective angle of view. Corresponding analysis of ICD volume and width of ICD between adjacent cardiomyocytes below. Scale bar: 5 μm. *P< 0.05, Mann-Whitney test. Each dot represents the value of one ICD from in total 4 mice per genotype. (B) Representative images of DSG2 (magenta) and filamentary actin (f-actin, white) z-stacks acquired by SIM and presented as maximum intensity projection. Lower row shows color-coded height projection of DSG2 signals in z-stack after signal thresholding as performed for analysis. Related analysis of DSG2 signal volume and number per ICD length is shown below. Pictograms on the right display the respective angle of view. Scale bar: 5 μm. *P< 0.05, unpaired Student’s t-test, with Welch’s correction. Each dot represents the value of one ICD from in total 3 mice per genotype. (C) FRAP analysis of DSG2-WT and DSG2-W2A-mGFP fusion proteins at the cell-cell junction of neonatal cardiomyocytes with representative intensity kymographs of bleached areas on the left. Time point 0 = bleach as indicated by the black arrow. Analysis of the mobile fraction of the indicated mGFP-fusion proteins is shown on the right. *P< 0.05, unpaired Student’s t-test, with Welch’s correction. Each dot represents the mean value of one heart from in total 3 isolations. (D) Representative triton-X-100 assay immunoblot with separation of a soluble (sol), non-cytoskeletal bound protein fraction from a non-soluble (non-sol), cytoskeletal-anchored fraction and corresponding analysis shown below. Plakoglobin (PG), plakophilin-2 (PKP2) and N-cadherin (NCAD) were analysed. Intensity of proteins was normalized to the total amount of protein detected by ponceau staining. GAPDH and desmoplakin (DSP) served as separation control. *P< 0.05 or as indicated, unpaired Student’s t-test (PG, NCAD, PKP2) or Mann-Whitney test (DSP). Each dot represents the result from one mouse. (E) Immunostaining of connexin-43 (CX43) (red in overlay) in DSG2-W2A hearts. N-cadherin (NCAD, yellow) marks ICDs, DAPI (blue) nuclei and F-actin (green) the sarcomere system. Orange arrows mark ICD, pink arrows highlight lateralization of CX43 staining. Scale bars: 25 μm. Images representative for 5 mice per genotype. Box with color indications of respective groups apply to the entire figure.
