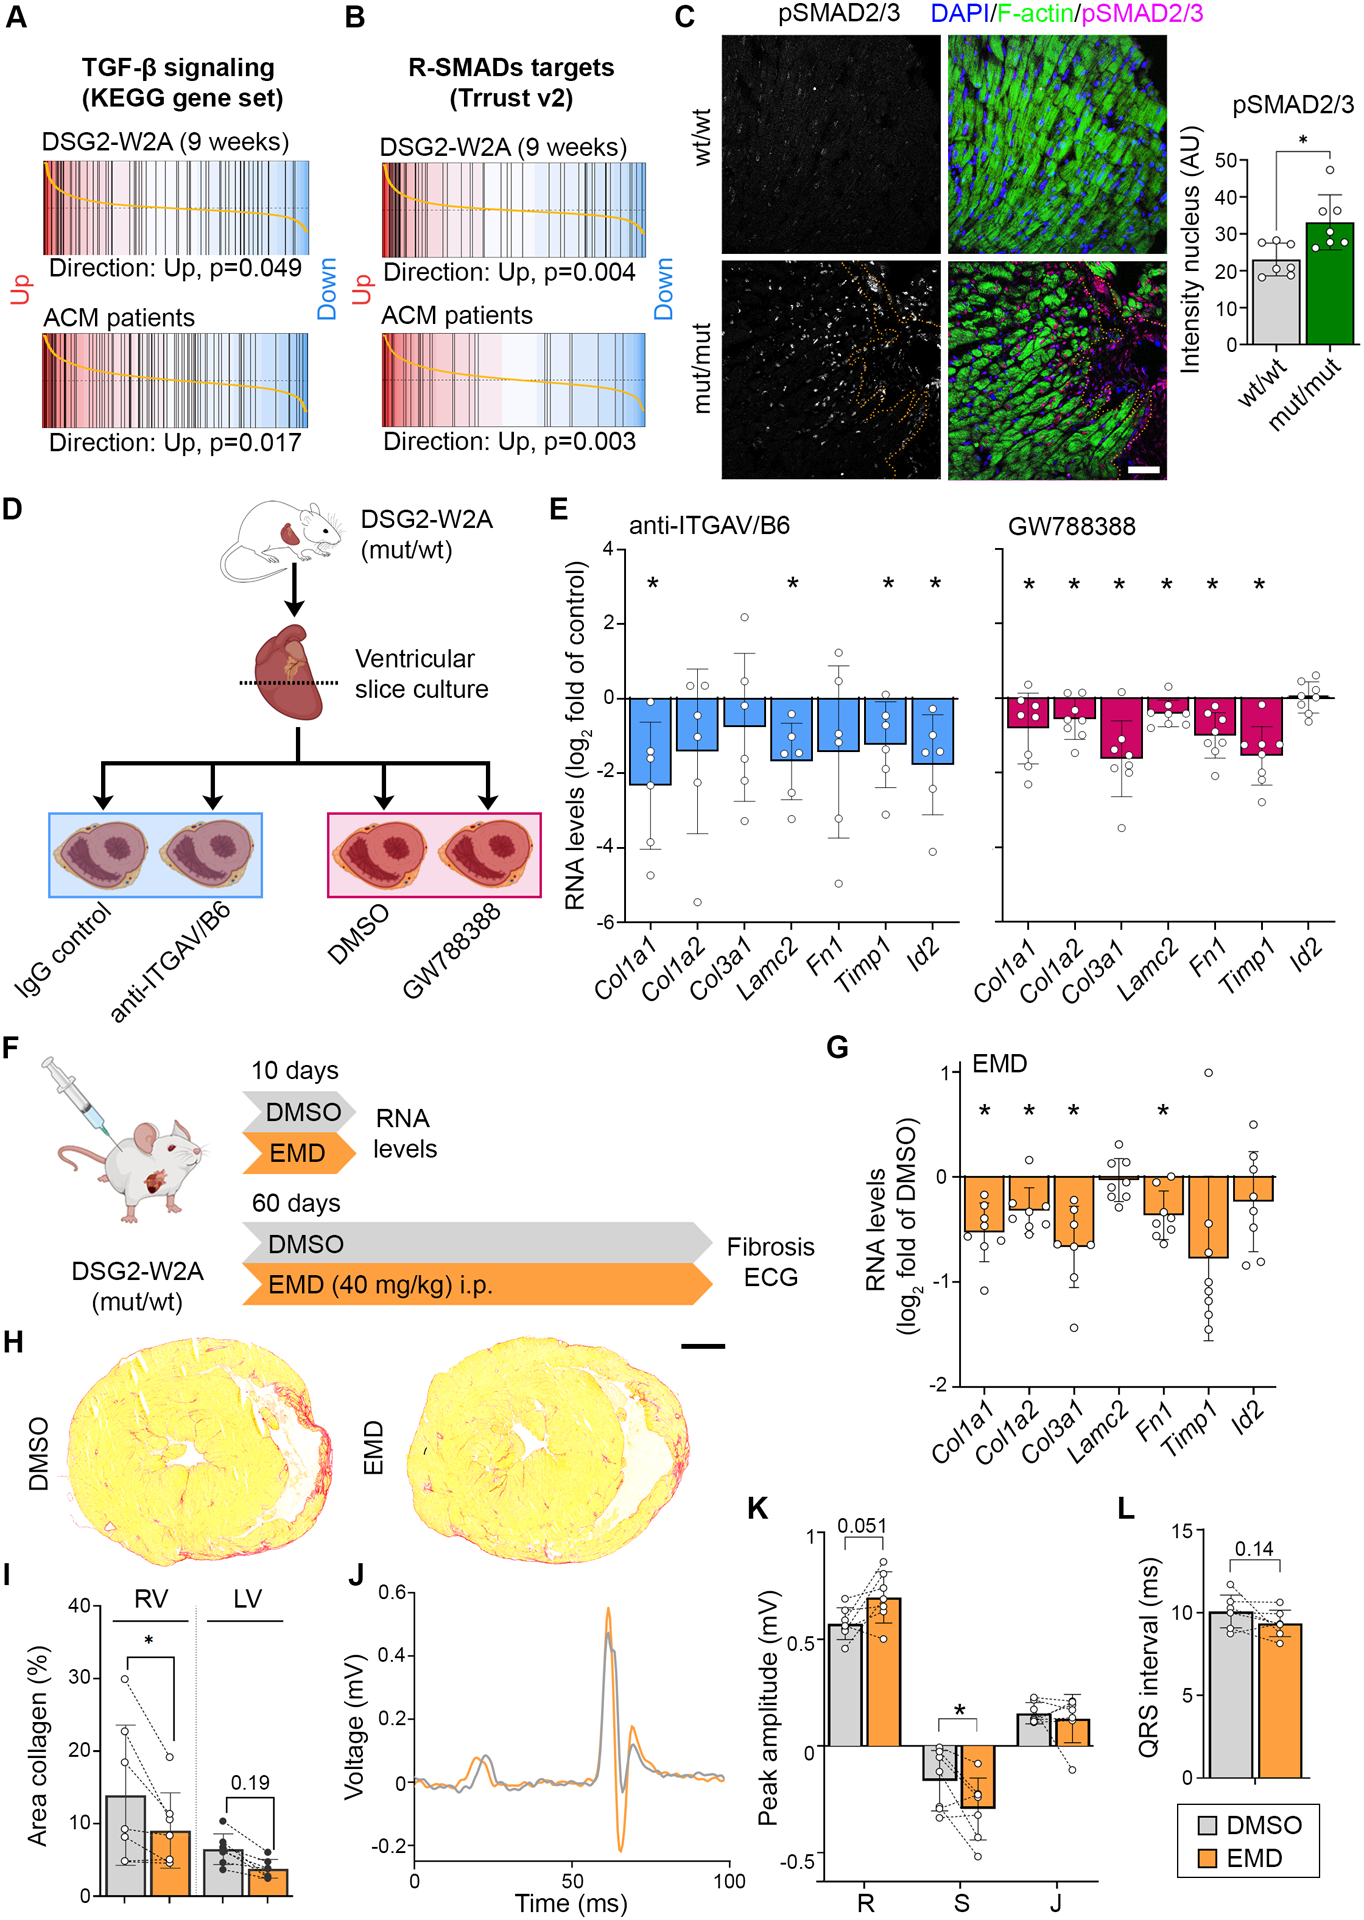
Figure 6. Elevated TGF-β signaling in DSG2-W2A hearts as result of ITGAV/B6 activity.

Barcode plots of gene set enrichment analysis of (A) the KEGG_TGF_BETA_SIGNALING_PATHWAY data set (systematic name: M2642),41 or (B) genes directly regulated by receptor-regulated SMADs (R-SMADs, includes SMAD1/2/3/5/9) as published in the TRRUST data base21 in 9-weeks-old DSG2-W2A (mut/mut vs wt/wt) or ACM patient data set 1 (ACM vs. healthy control, GEO: GSE107157/GSE107480). Indicated p-values are calculate by function cameraPR of the R package limma. (C) Immunostainings of phosphorylated SMAD2/3 (magenta, S465/S467 or S423/S425, respectively) in sections of DSG2-W2A hearts and related analysis of nuclear staining intensity. Nuclei are stained with DAPI (blue), cardiomyocytes are marked with f-actin (green). Dotted orange line marks edge of fibrotic area. Scale bar: 50 μm. *P< 0.05, unpaired Student’s t-test. (D) Schematic of experimental set-up for ITGAV/B6 blocking experiments in cardiac slice culture with related results in E. Icons are derived from BioRender. (E) qRT-PCR analysis of expression of genes downstream of TGF-β signaling in cardiac slices cultures treated with inhibiting anti-ITGAV/B6 (1:15) or 10 μmol/l GW788388, an inhibitor of TGF-β receptor I, for 24 hours. *P< 0.05, paired Student’s t-test vs. indicated control condition. (F) Schematic of experimental set-up for in vivo ITGAV/B6 blocking experiments by injection of 40 mg/kg EMD527040 (EMD) i.p. daily. DMSO was applied as vehicle control. Icons are derived from BioRender. (G) qRT-PCR expression analysis of genes downstream of TGF-β signaling in hearts of mice treated with EMD or respective amount of DMSO for 10 days. *P< 0.05, unpaired Student’s t-test vs. DMSO. (H, I) Cardiac fibrosis detected by picrosirius red collagen staining with representative images and corresponding analysis of the area of collagen in the right (RV) and left ventricle (LV). Lines indicate littermates. Each dot represents one animal. *P< 0.05 or as indicated, grouped two-way RM ANOVA with LV/RV and experimental pairs matched, Sidak’s post hoc test. Scale bar: 1 mm. (J – L) ECG recoded in lead II with representative curves shown in J. Corresponding analysis of R, S, and J peak amplitude and QRS interval, *P< 0.05 or as indicated, Paired student’s t-test. Lines indicate littermates. Each dot represents one animal.
