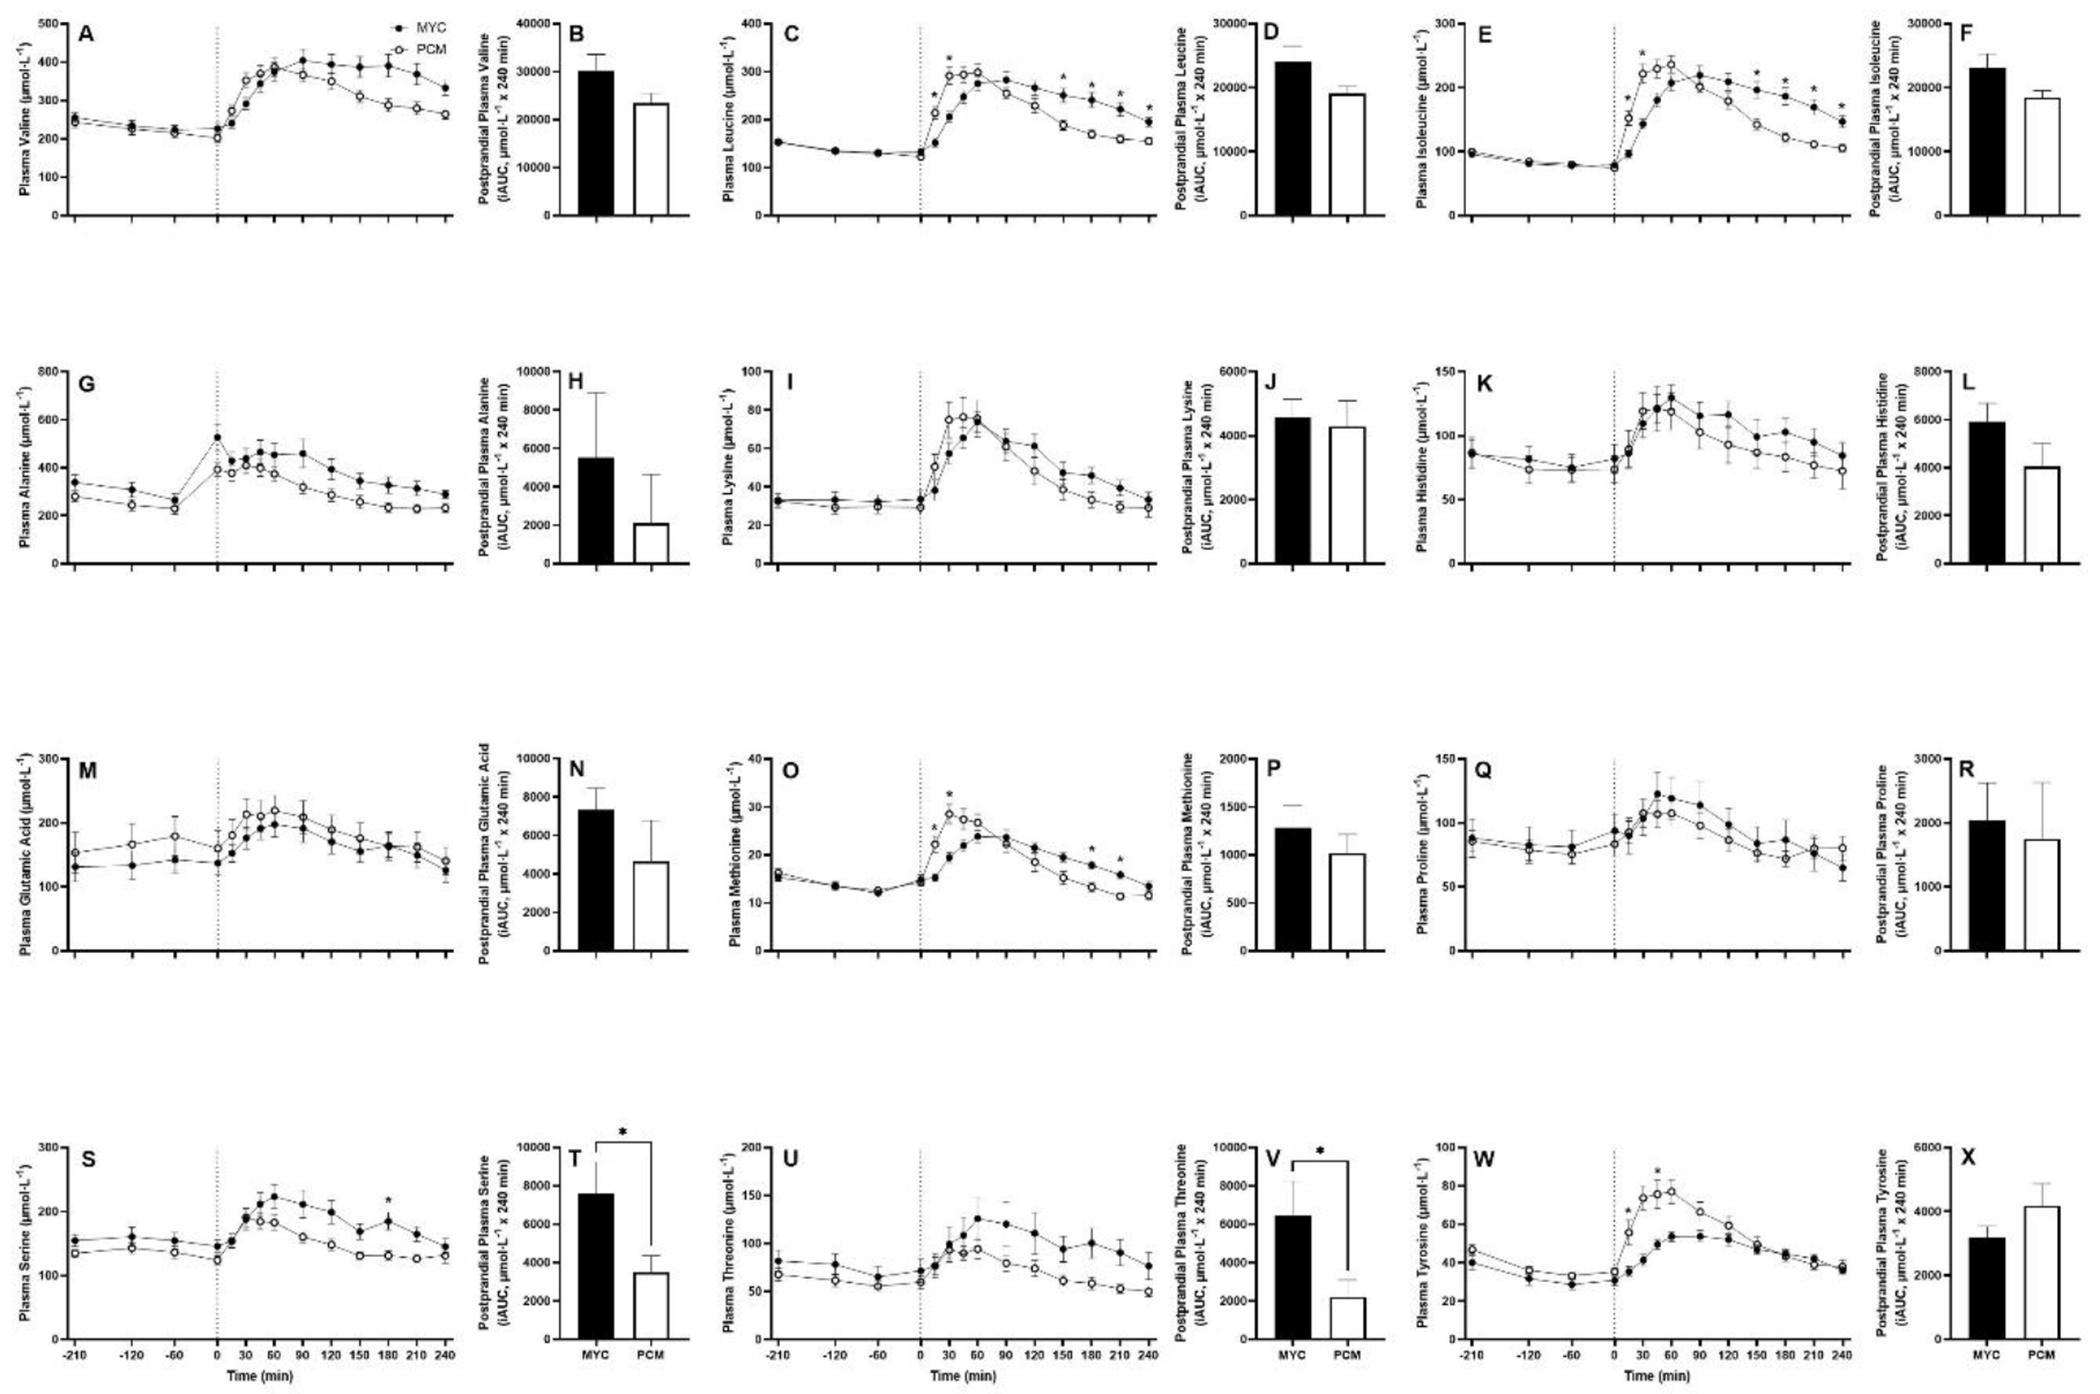
FIGURE 4.

Time course and incremental area under the curve (iAUC; calculated as above postaborptive values) of valine (A, B), leucine (C, D), isoleucine (E, F), alanine (G, H), lysine (I, J), histidine (K, L), glutamic acid (M, N), methionine (O, P), proline (Q, R), serine (S, T), threonine (U, V) and tyrosine (W, X) over a 3.5 h postabsorptive period (time course only) and 4 h postprandial period in healthy resistance trained men. The dashed vertical line represents drink consumption (70 g of mycoprotein containing 31.5 g protein and 2.5 g leucine [MYC; n=12] or 38.2g of protein concentrated from mycoprotein containing 28.0 g protein and 2.5 g leucine [PCM; n=12]), and execution of a bout of unilateral resistance leg exercise. Time course data were analysed using a 2-way repeated measures ANOVA (group x time) with Sidak post-hoc tests used to detect differences at individual time points. iAUC data were analysed using an independent t-test. * denotes individual differences between conditions at that time point and a difference between conditions on the bar graphs (P<0.05). Time x group interaction (all P<0.001) except glutamic acid and proline (both P>0.05). Values are mean ± SEM.
