Figure 4.

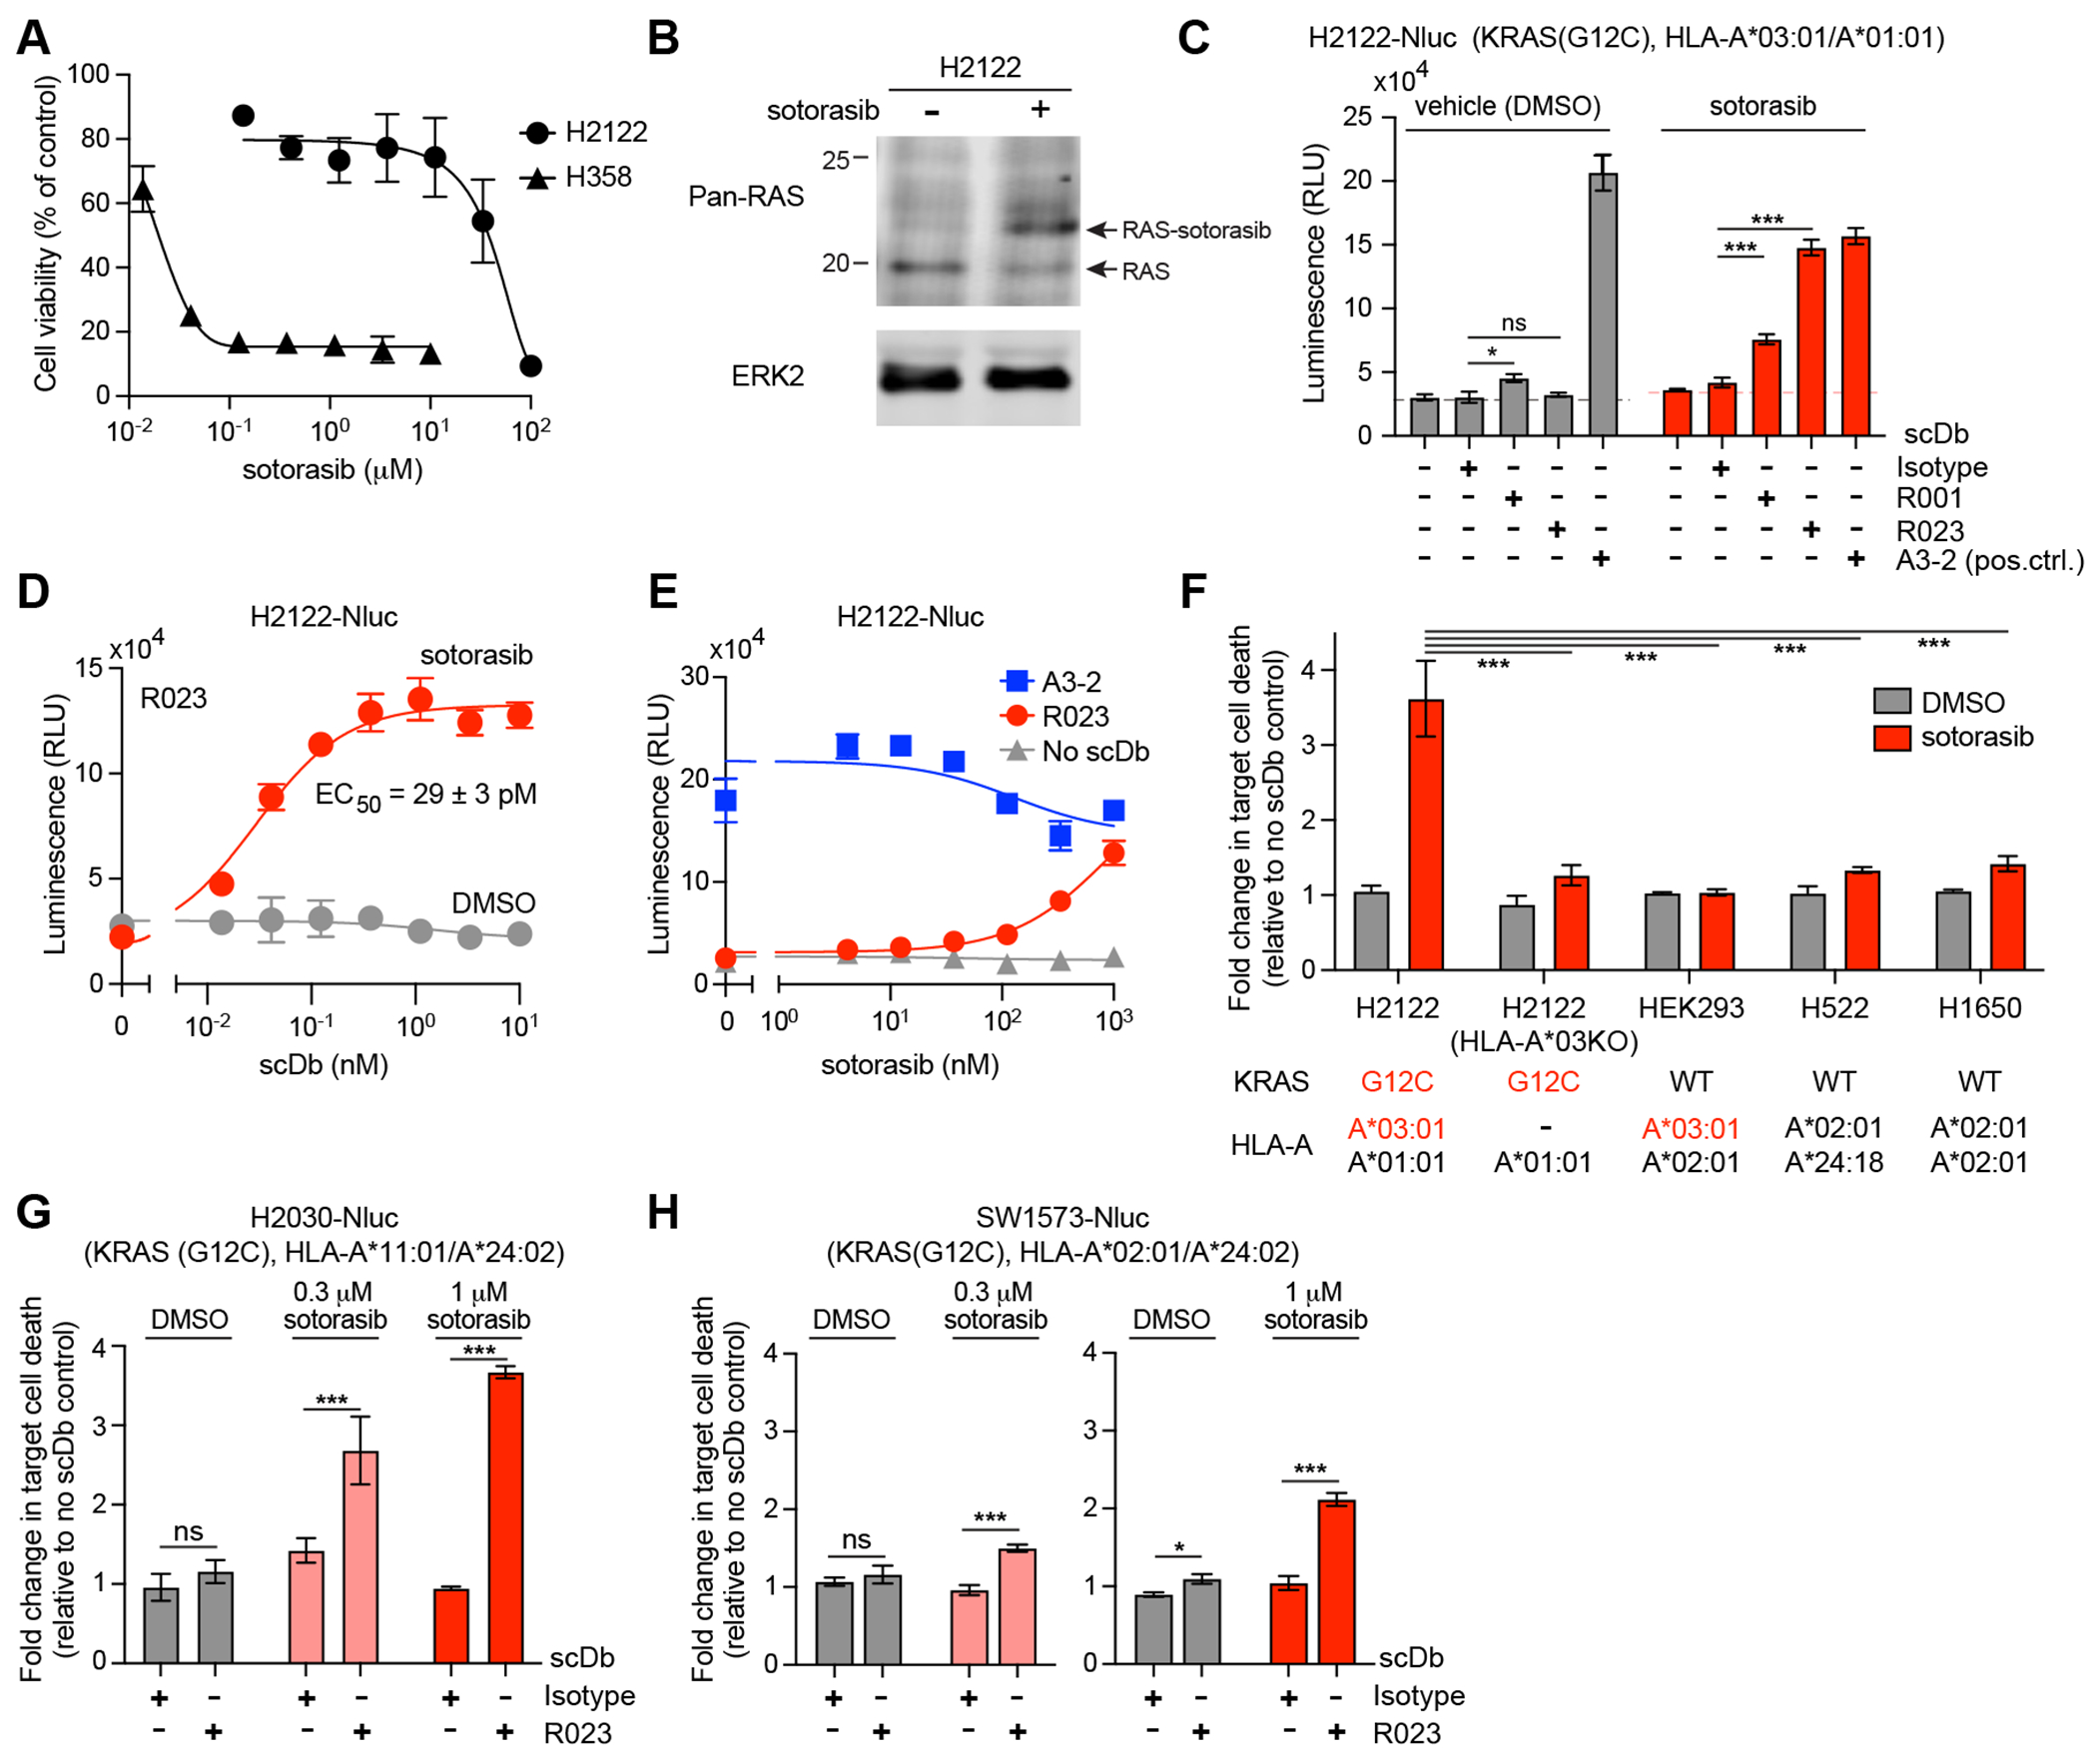
Cytotoxic effect of R023 scDb on sotorasib-treated tumor cells. (A) Dose response curves of the viability of H358 and H2122 cells following exposure to sotorasib for 72 hr. (B) Analysis of sotorasib conjugation to KRAS(G12C) in H2122 cells by Western blot. H2122 cells were incubated with 100 nM sotorasib for 24hr. The arrow indicates KRAS(G12C) conjugated to sotorasib. Note that the anti-pan-RAS antibody detects KRAS, HRAS, and NRAS, so complete shift of the original band is not expected. (C) Cytotoxic effects of the indicated scDbs on H2122-Nluc cells treated with 1 μM sotorasib. The scDb concentration was 10 nM except for the A3-2 scDb (1 nM). (D) Cell killing titration curve of the R023 scDb on H2122-Nluc cells treated with 1 μM sotorasib. (E) Dependence of cell killing on sotorasib concentration with the indicated scDbs at 1 nM. (F) HLA dependence of cell killing by R023 scDb. The normalized luminescence intensity (see Supplementary Fig. S5A for the procedure) is shown for cell lines treated with 0.3 μM sotorasib and cocultured with T cells in the presence of 1 nM scDbs and 0.3 μM sotorasib. KRAS mutation state and HLA alleles for the cell lines are shown. (G,H) Cytotoxic effects of the R023 scDb (1 nM) on H2030-Nluc (G) and SW1573-Nluc (H) cells treated with sotorasib. Data shown are from technical quadruplicate measurements, representative of ≥2 equivalent measurements. Data represent mean ± s.d., one-way ANOVA with Tukey’s multiple comparison test; *P < 0.05, **P < 0.01, ***P <0.001. See Supplementary Fig. S5 for raw data for panels F–H.
