
Figure 1. CRISPR screens uncover functional interplay between the mammalian MLL1 and MLL3/4 chromatin modifying complexes.
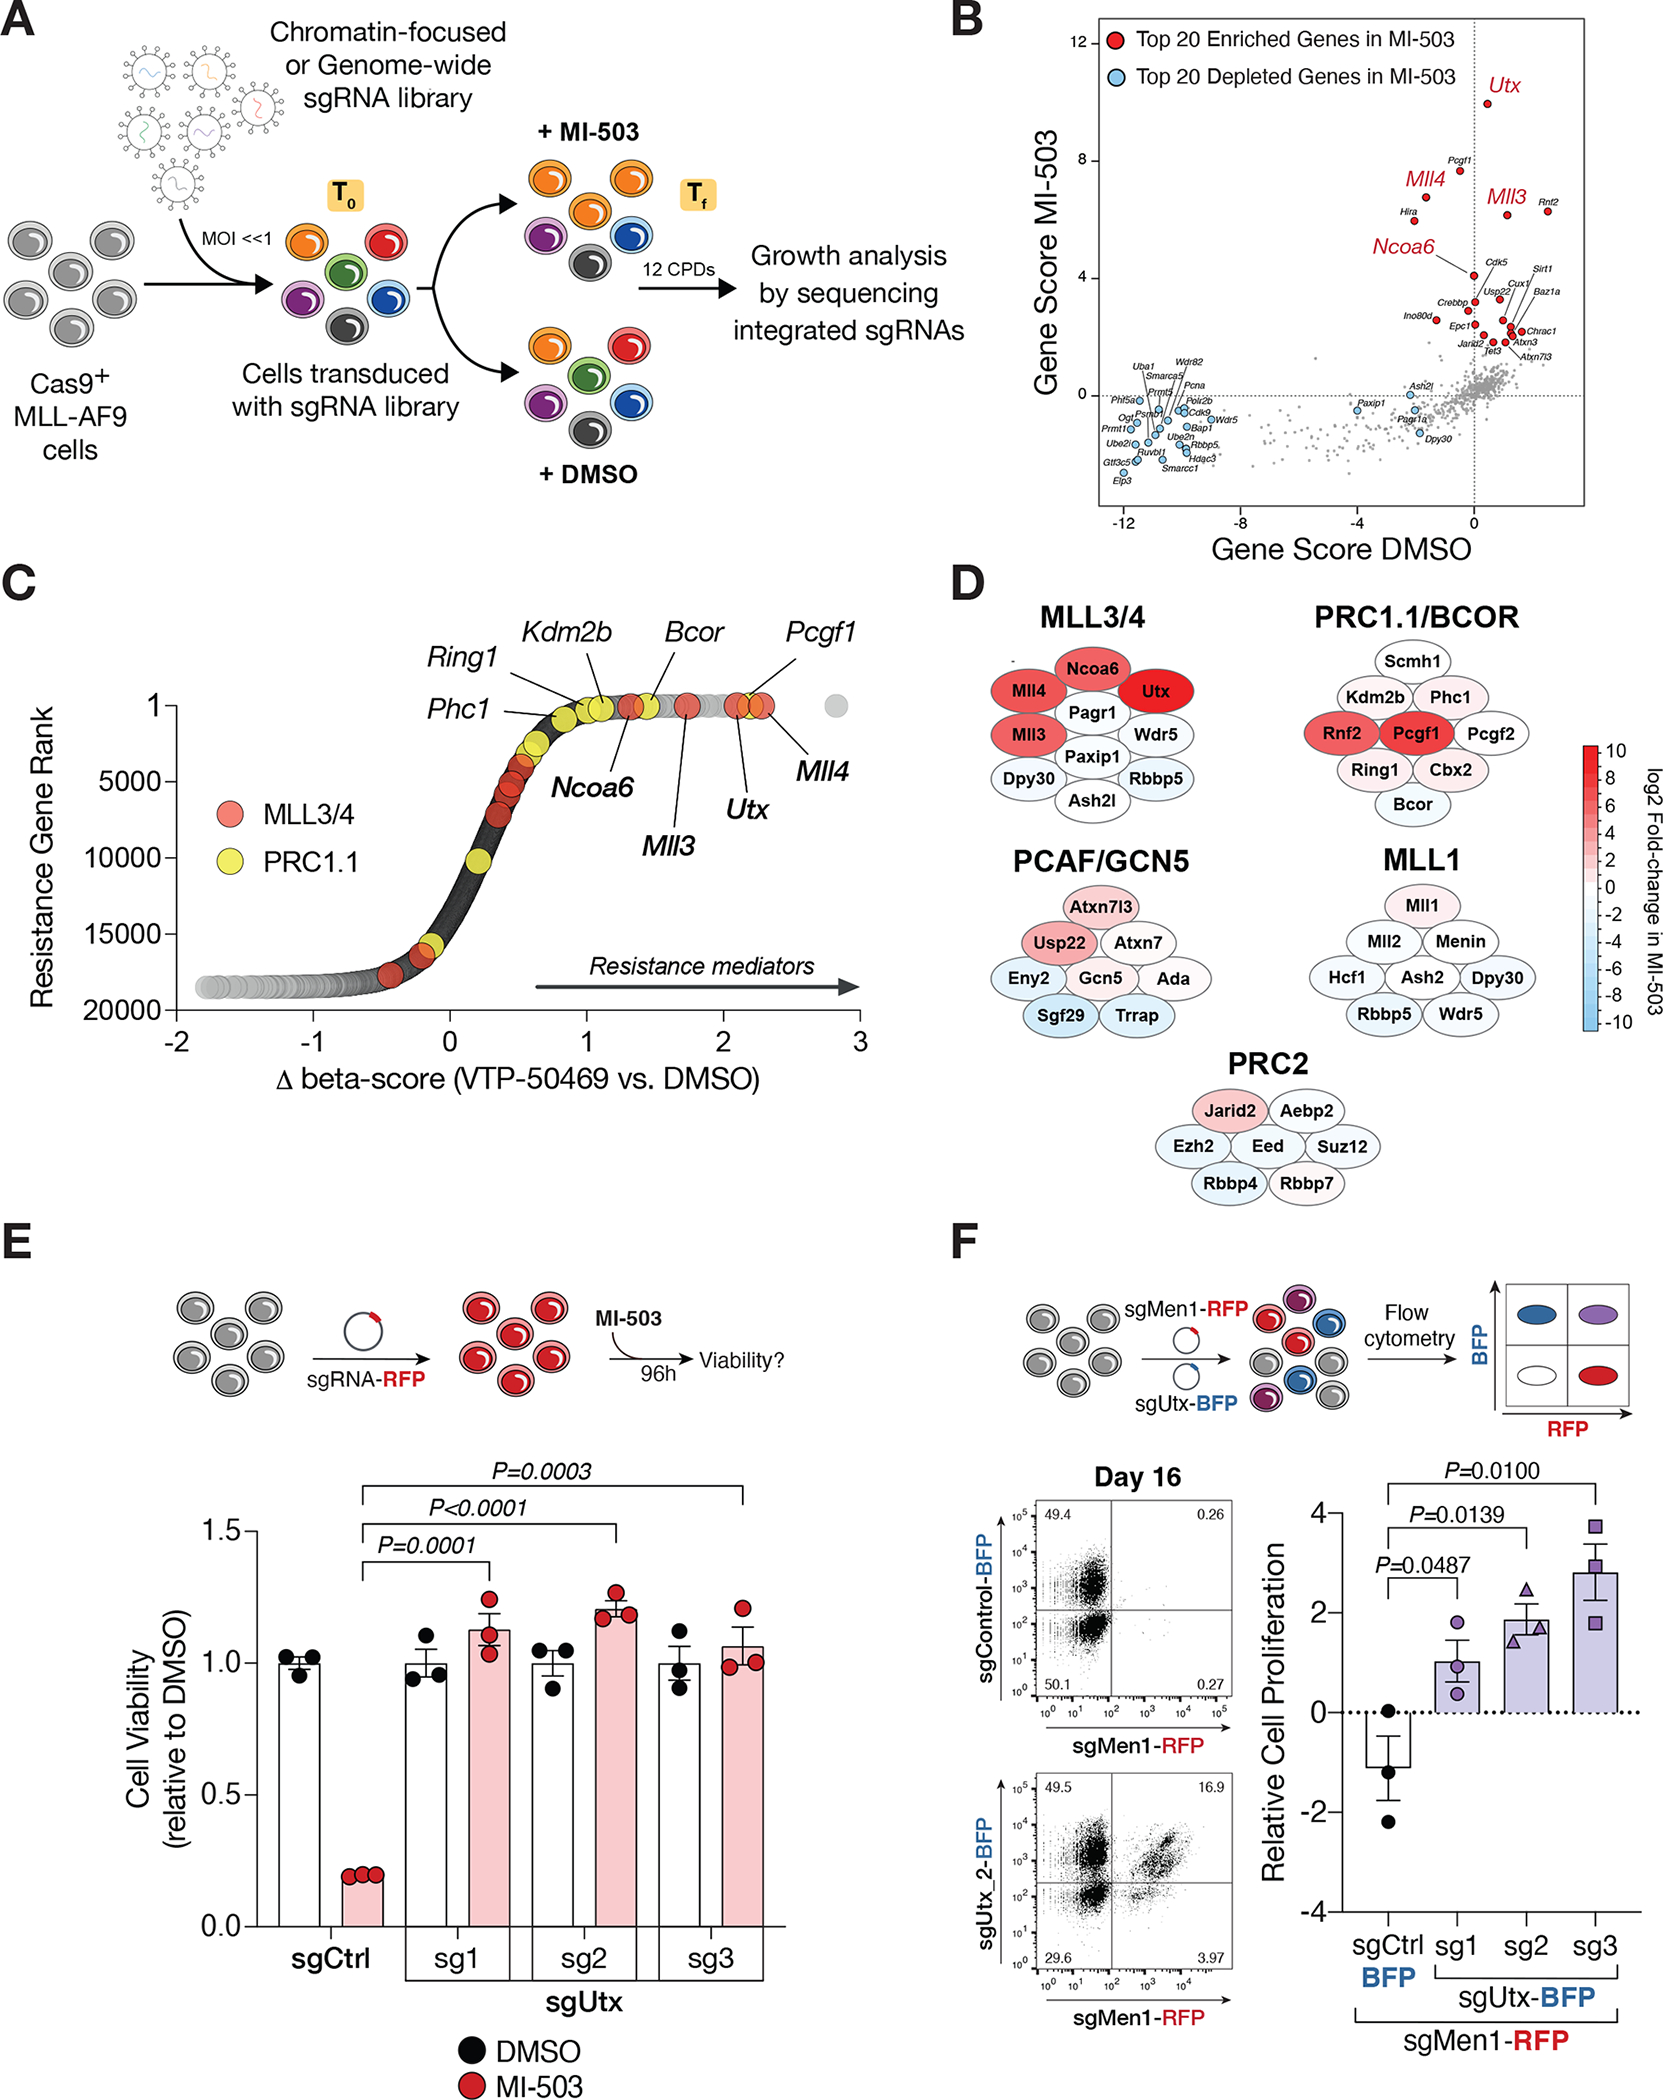
(A) CRISPR-Cas9-based screening strategy to identify regulators of response to Menin-MLL inhibition. CPD, cell population doublings; sgRNA, single guide RNA; Tf, final timepoint; T0, initial timepoint. (B) Chromatin-focused CRISPR screening data showing the top 20 most significantly enriched (red) and depleted (blue) genes in the Menin-MLL inhibitor (MI-503) treatment relative to vehicle (DMSO). Gene scores are shown as the mean log2 fold-change in abundance of the 6 sgRNAs targeting each gene in each condition. (C) Genome-wide CRISPR screening data showing gene-level ranking based on differential enrichment of sgRNAs in the Menin-MLL inhibitor treatment (VTP-50469) relative to vehicle (DMSO). Differential (Δ) beta-score between VTP-50469 and DMSO conditions was calculated using MaGeCK. A positive Δ beta-score denotes enrichment of specific gene-targeting sgRNAs. A negative Δ beta-score denotes depletion of specific gene-targeting sgRNAs. Red circles denote MLL3/4-UTX complex subunits. Yellow circles denote PRC1.1 complex subunits. (D) Schematic representation of the top scoring chromatin regulators in the chromatin-focused MI-503 screen and their corresponding protein complexes. Red denotes enriched subunits. Blue denotes depleted subunits. Color scale represents the log2 fold-change in abundance of the 6 sgRNAs targeting each subunit in the Menin-MLL inhibitor (MI-503) treatment relative to vehicle (DMSO). (E) Viability assay from cells treated with vehicle (DMSO, black) or Menin-MLL inhibitor (MI-503, red) for 96 hours (mean±SEM, n=3 infection replicates, P-value calculated by Student’s t-test). sgCtrl, control sgRNA targeting a non-genic region on chromosome 8. (F) Relative cell proliferation is shown as the proliferation of double positive cells (sgMen1-RFP + sgUtx-BFP or sgMen1-RFP + sgCtrl-BFP) relative to single positive cells (sgMen1-RFP) 16 days post-infection measured by flow cytometry (mean±SEM, n=3 infection replicates, P-value calculated by Student’s t-test). Representative FACS plots are shown for sgControl and sgUtx targeted cells.