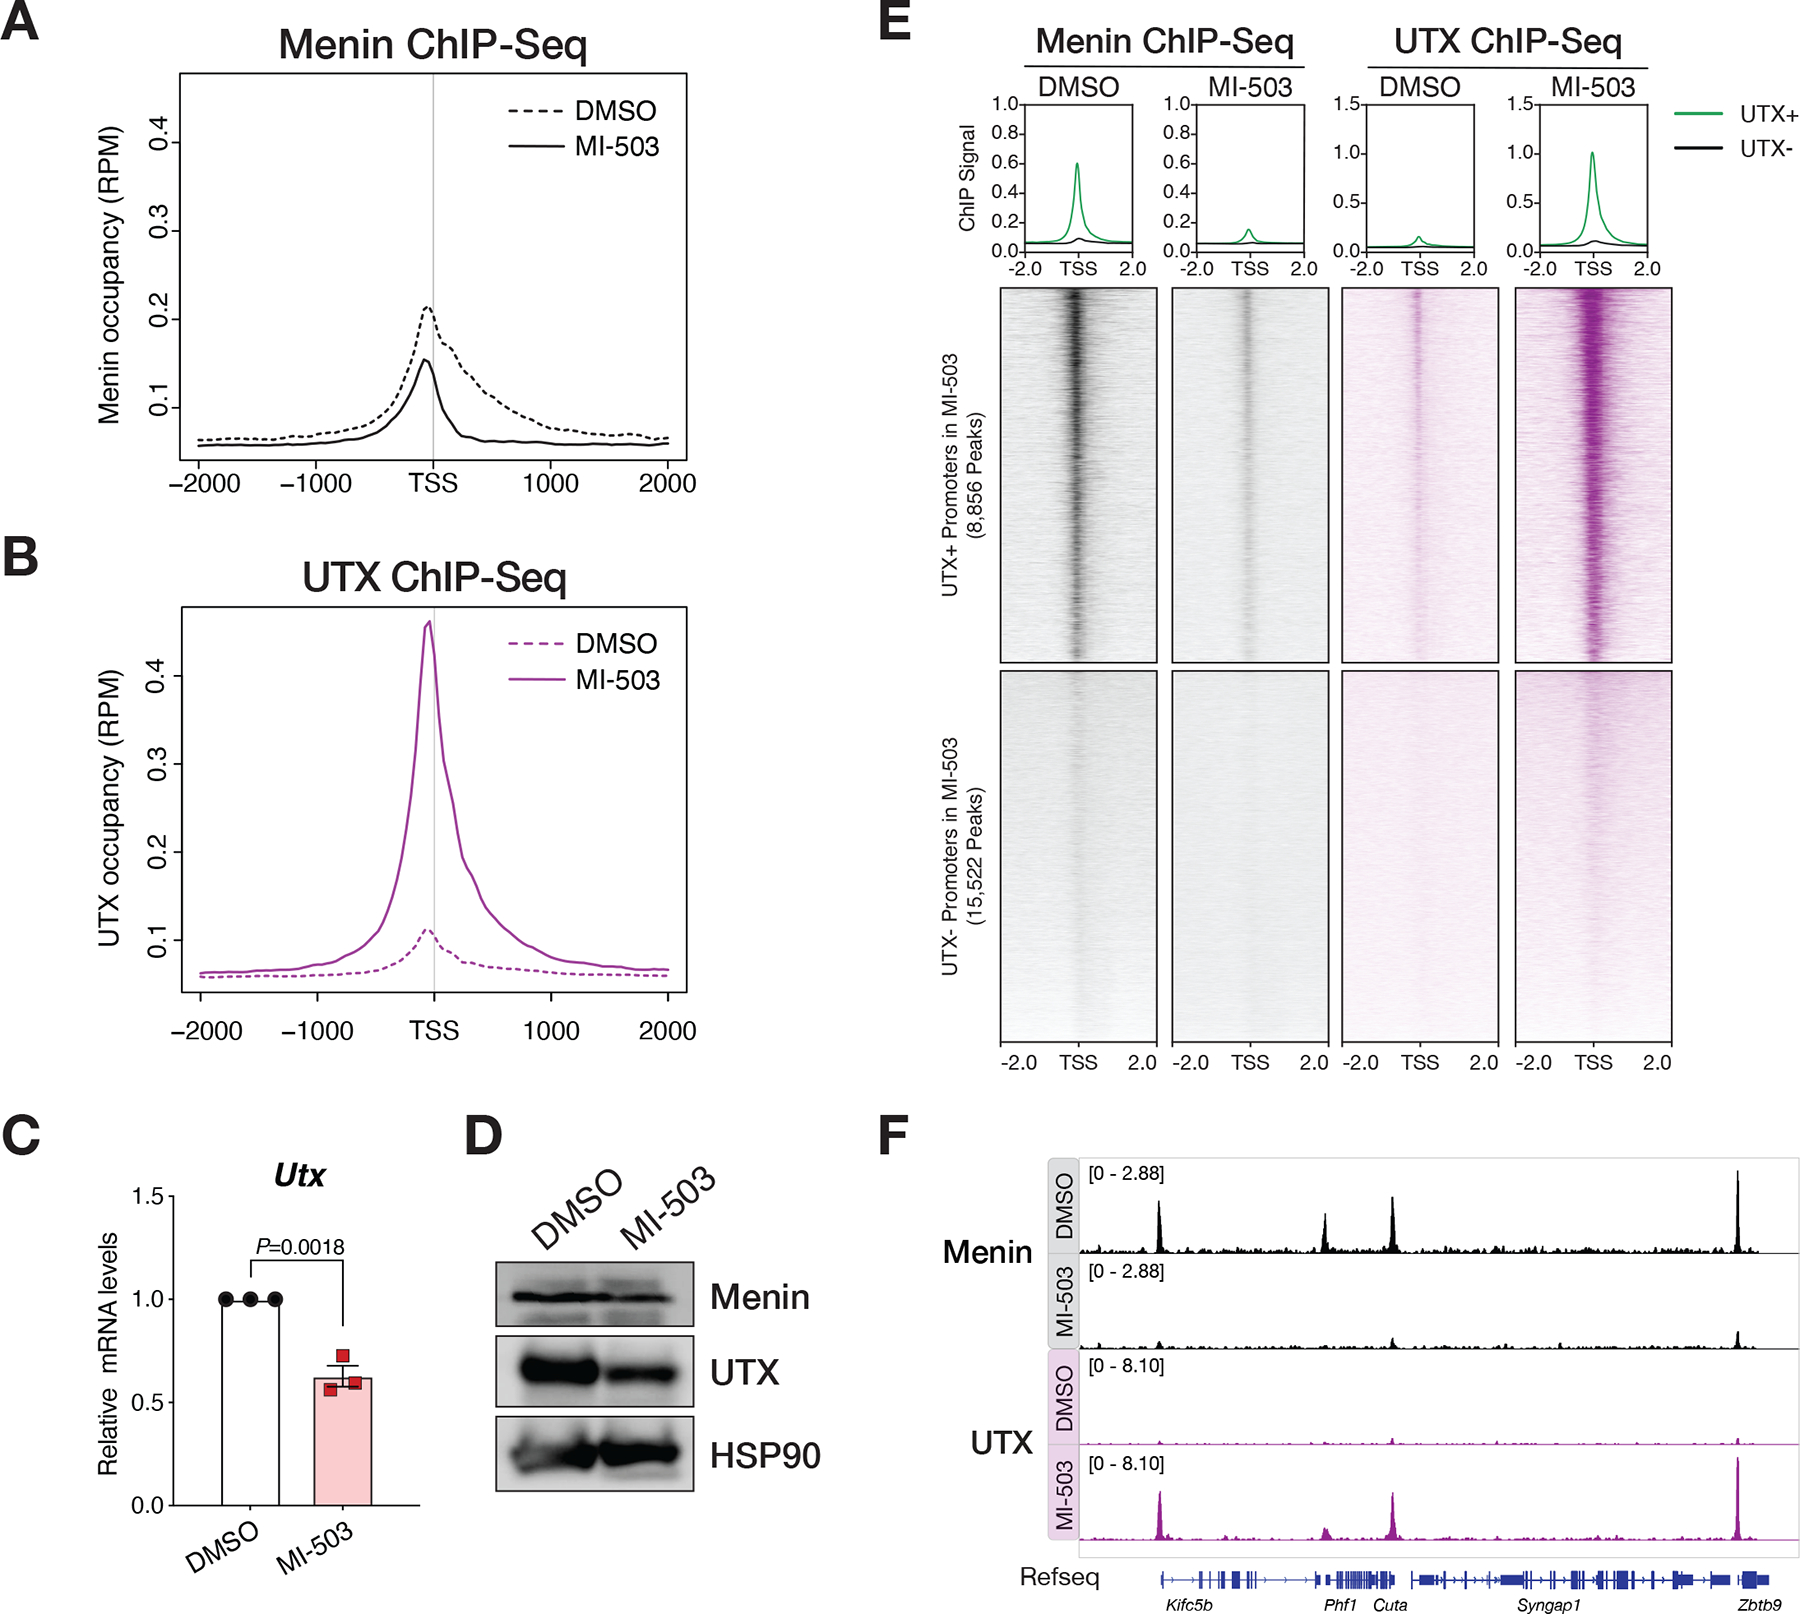
Figure 2. MLL1-Menin complex restricts chromatin occupancy of MLL3/4-UTX at promoters of target genes.

(A) Metagene analysis showing the average chromatin occupancy of Menin at transcription start sites (TSS), and a region 2000bp downstream and upstream of the TSS. Signals corresponding to cells treated with Menin-MLL inhibitor (MI-503, solid) compared to cells treated with vehicle (DMSO, dotted) for 96 hours are shown. RPM, reads per million. (B) Metagene analysis showing the average chromatin occupancy of UTX at transcription start sites (TSS), and a region 2000bp downstream and upstream of the TSS. Signals corresponding to cells treated with Menin-MLL inhibitor (MI-503, solid) compared to cells treated with vehicle (DMSO, dotted) for 96 hours are shown. RPM, reads per million. (C) Relative Utx mRNA levels determined by qPCR in mouse MLL-AF9 leukemia cells treated with Menin-MLL inhibitor (MI-503, red) compared to vehicle (DMSO, black) for 96 hours (mean ± SEM, n=3 replicates, P-value calculated by Student’s t-test). (D) Immunoblot analysis of Menin, UTX, and HSP90 proteins (loading control) upon Menin-MLL inhibitor (MI-503) treatment of mouse MLL-AF9 leukemia cells for 96 hours. (E) Heatmaps displaying Menin (black) and UTX (purple) ChIP-Seq signals mapping to a 4kb window around TSS. Data is shown for DMSO and MI-503-treated cells for 96 hours. Metagene plot shows the average ChIP-Seq signal for Menin or UTX at promoters that are UTX+ (green) or UTX- (black) post MI-503 treatment. (F) Genome browser representation of ChIP-Seq normalized reads for Menin (black) and UTX (purple) in mouse MLL-AF9 leukemia cells treated with either vehicle (DMSO) or Menin-MLL inhibitor (MI-503) for 96 hours.
