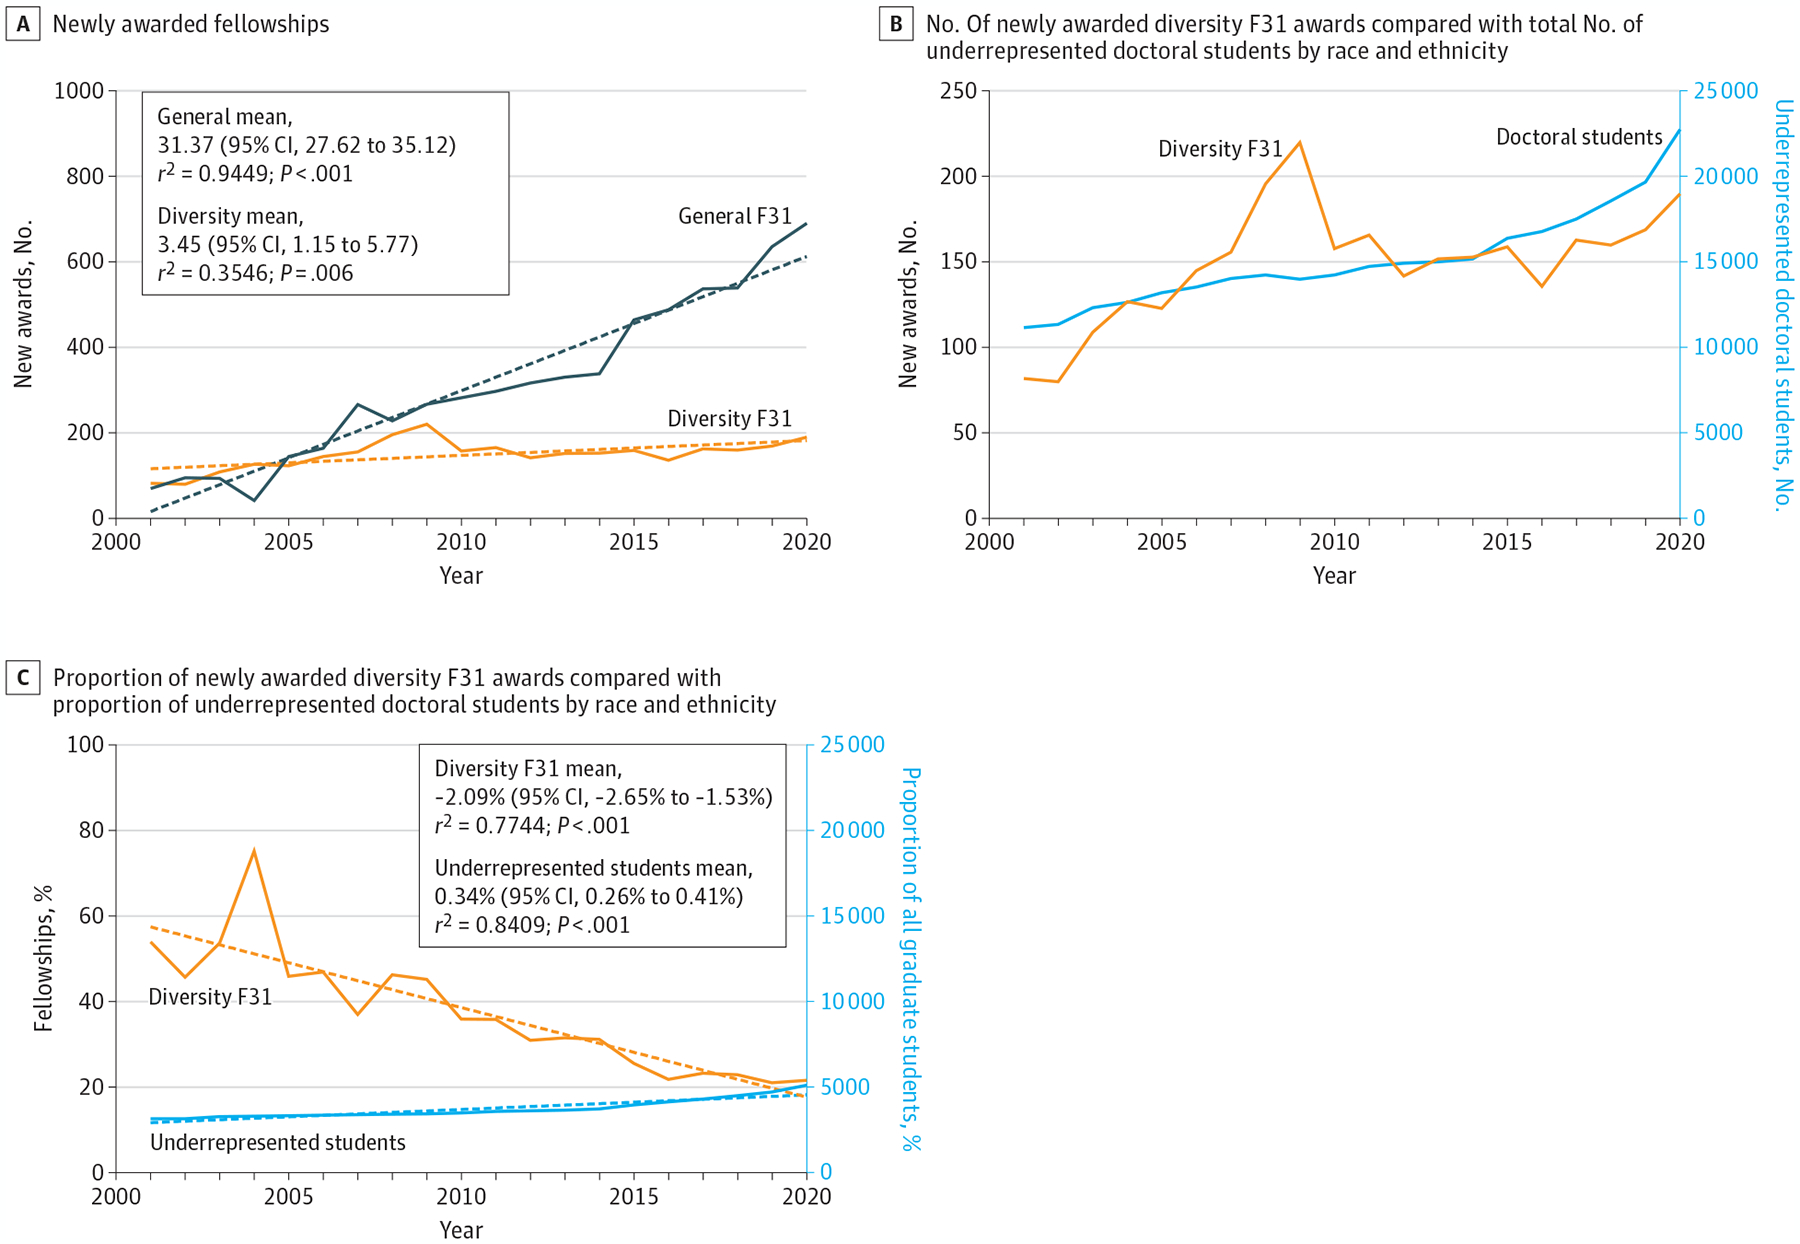
Figure 1. Trends in Annual Count of Newly Awarded F31 General and F31 Diversity Fellowships.

A, Count of newly awarded fellowships over time for general and diversity F31 awards with linear regression trends analysis. B, Count of newly awarded diversity F31 awards compared with total number of underrepresented by race and ethnicity (eg, Black, Hispanic, American Indian, Alaska Native) students. C, Percentage of newly awarded diversity F31 awards compared with proportion of underrepresented students.
Dotted lines indicate the simple linear regression best fit line for each award type, and P values indicates statistical significance of slopes from 0.
