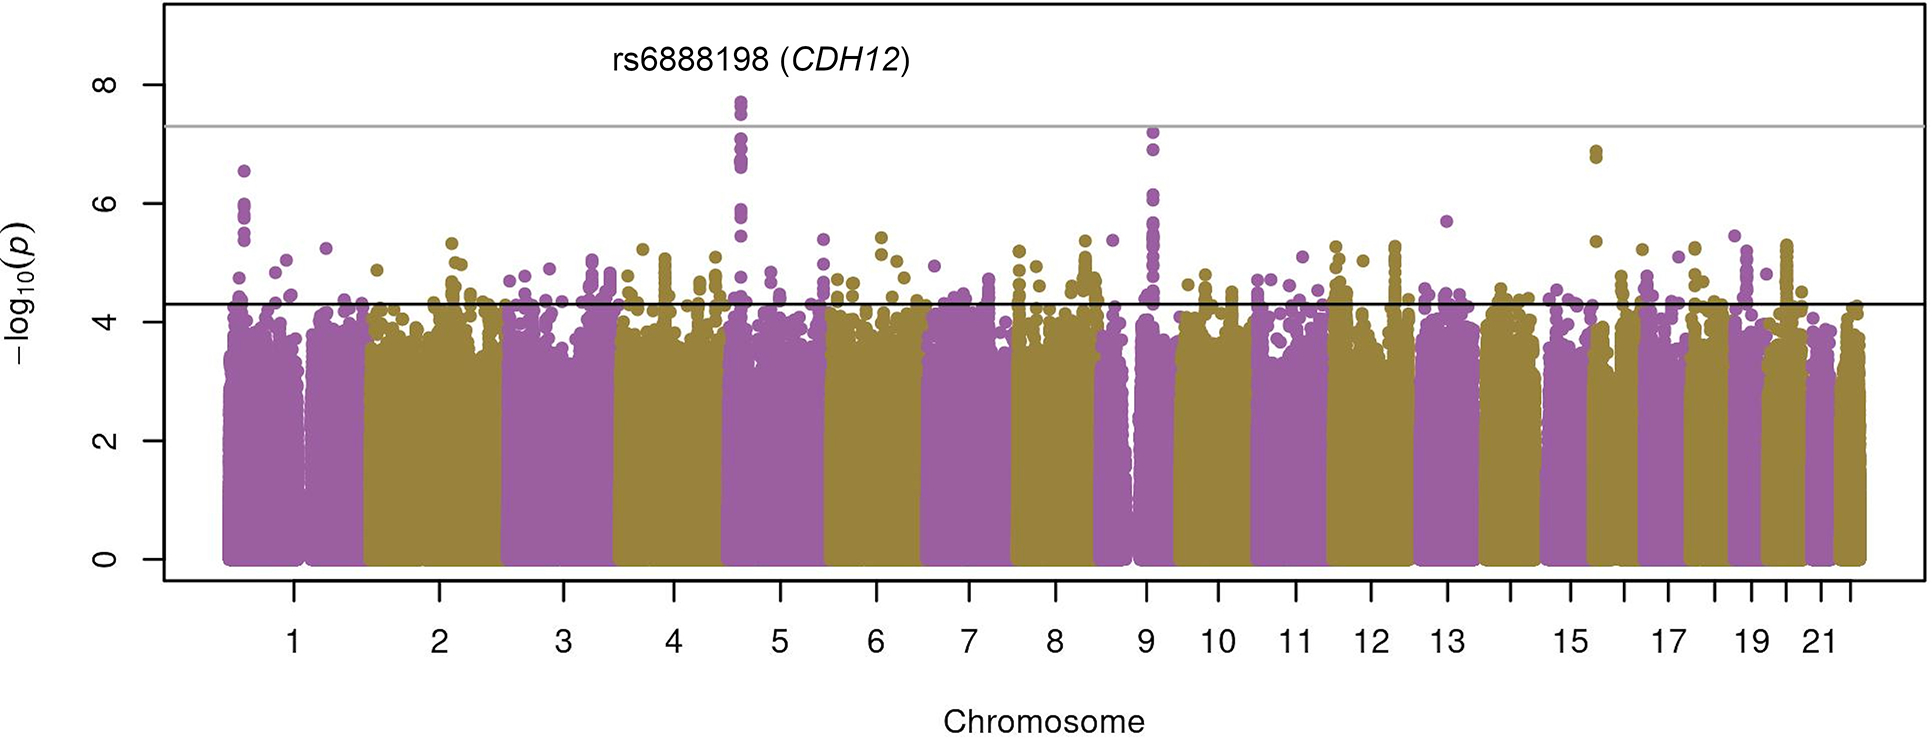
Figure 1. Manhattan plot of the results of the discovery stage of the multi-ancestry meta-analysis of GWAS of asthma exacerbations (represented as -log10 p-value on the y-axis) along the chromosome position of the variants analyzed (x-axis).

The suggestive (p=5×10⁻⁵) and genome-wide (p=5×10⁻⁸) significance thresholds are indicated by the black line and dark gray lines.
