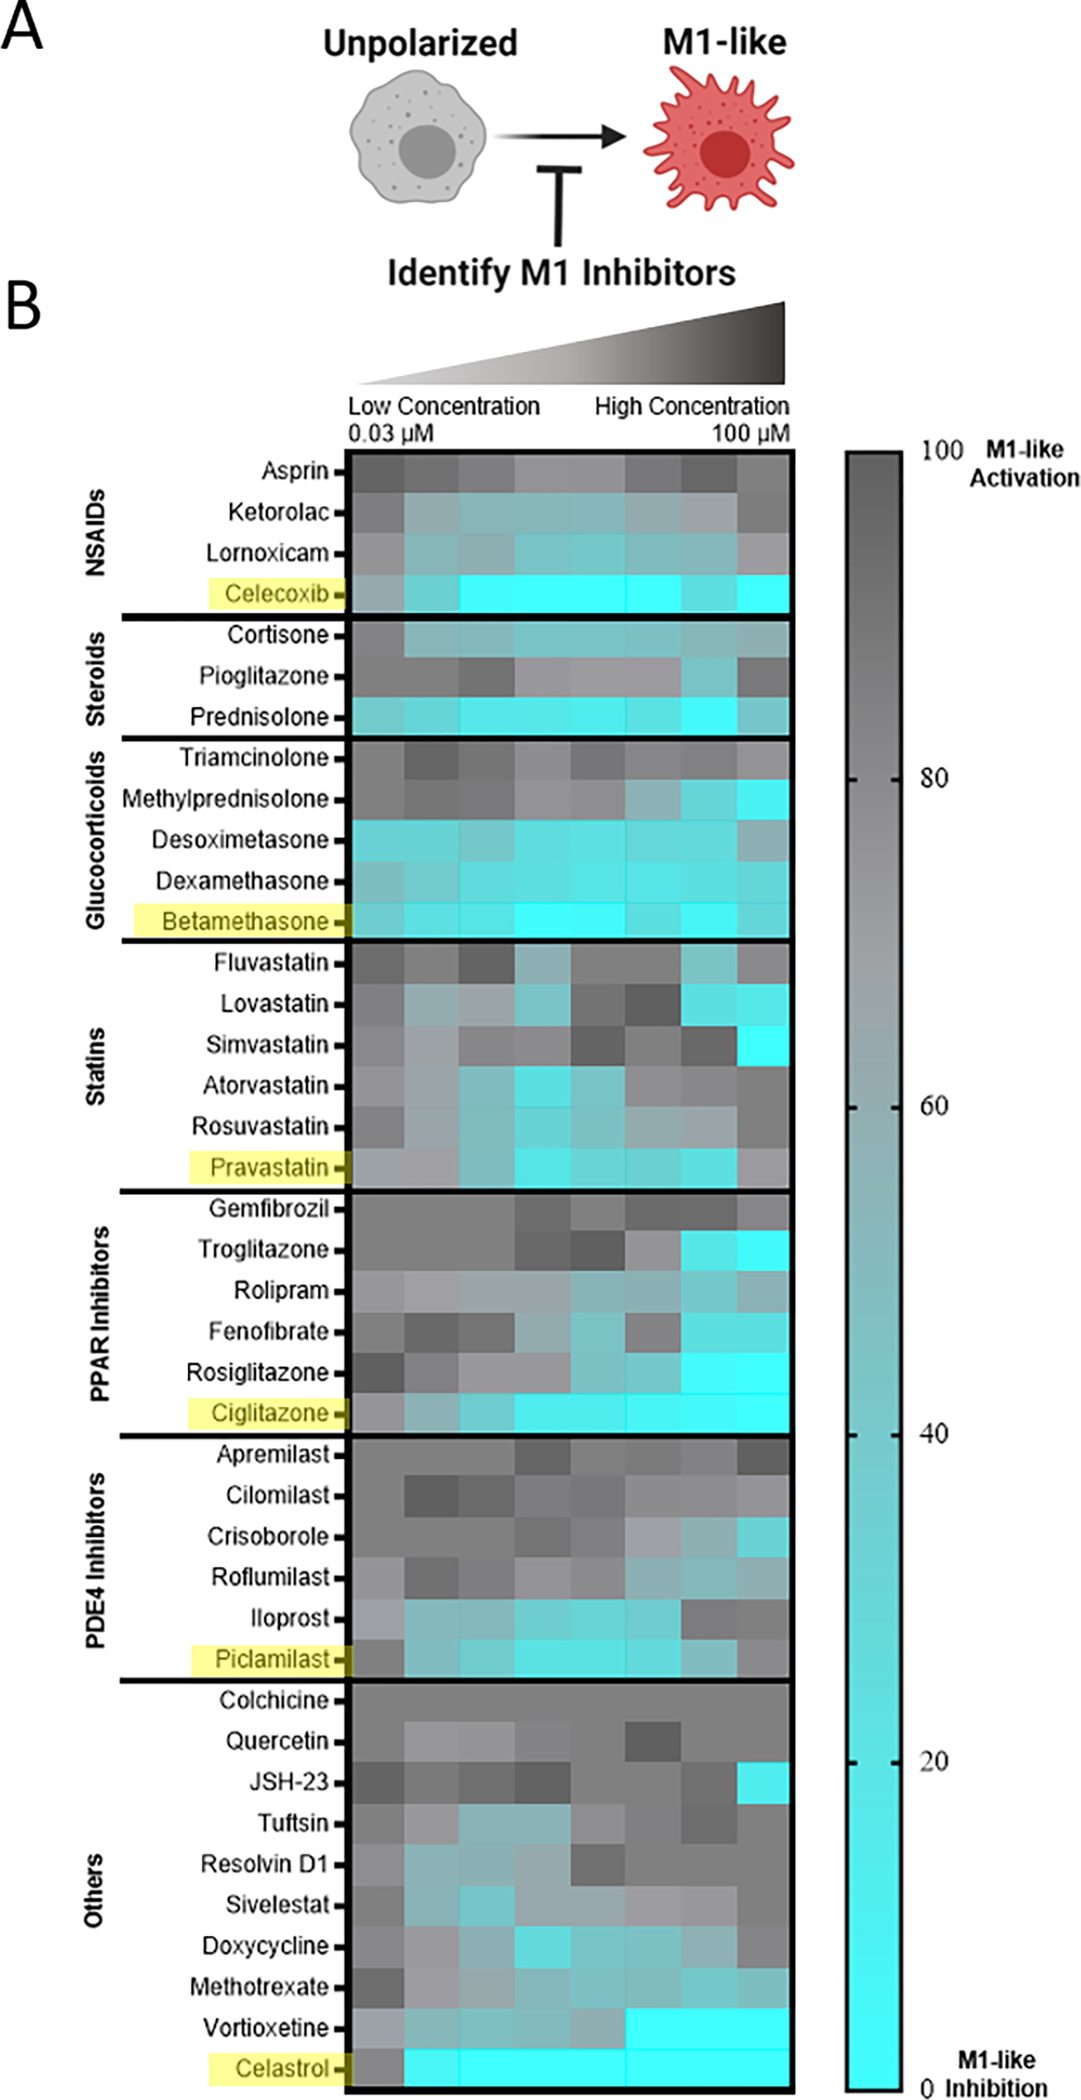
Figure 4. Initial drug screening identifies pharmacological inhibitors of M1-like MF activation.

A) RAW-Blue™ cells were concurrently treated by zymosan (100 μg/mL) and the indicated drug, spanning a dose response from 100 μM to 31.6 nM in half-log titration to identify M1-like inhibitors. B) Heatmap of compound bioactivities in reporter cells. Results represent the mean of n = 4 independent samples, subsequent to subtraction of untreated controls and normalization to zymosan-treated cells such that a lighter blue color indicates desired inhibition of M1-like response. Within each drug class, compound bioactivity is rank ordered according to cumulative suppression of M1-supression across all doses. Compounds selected for subsequent evaluation are indicated in yellow.
