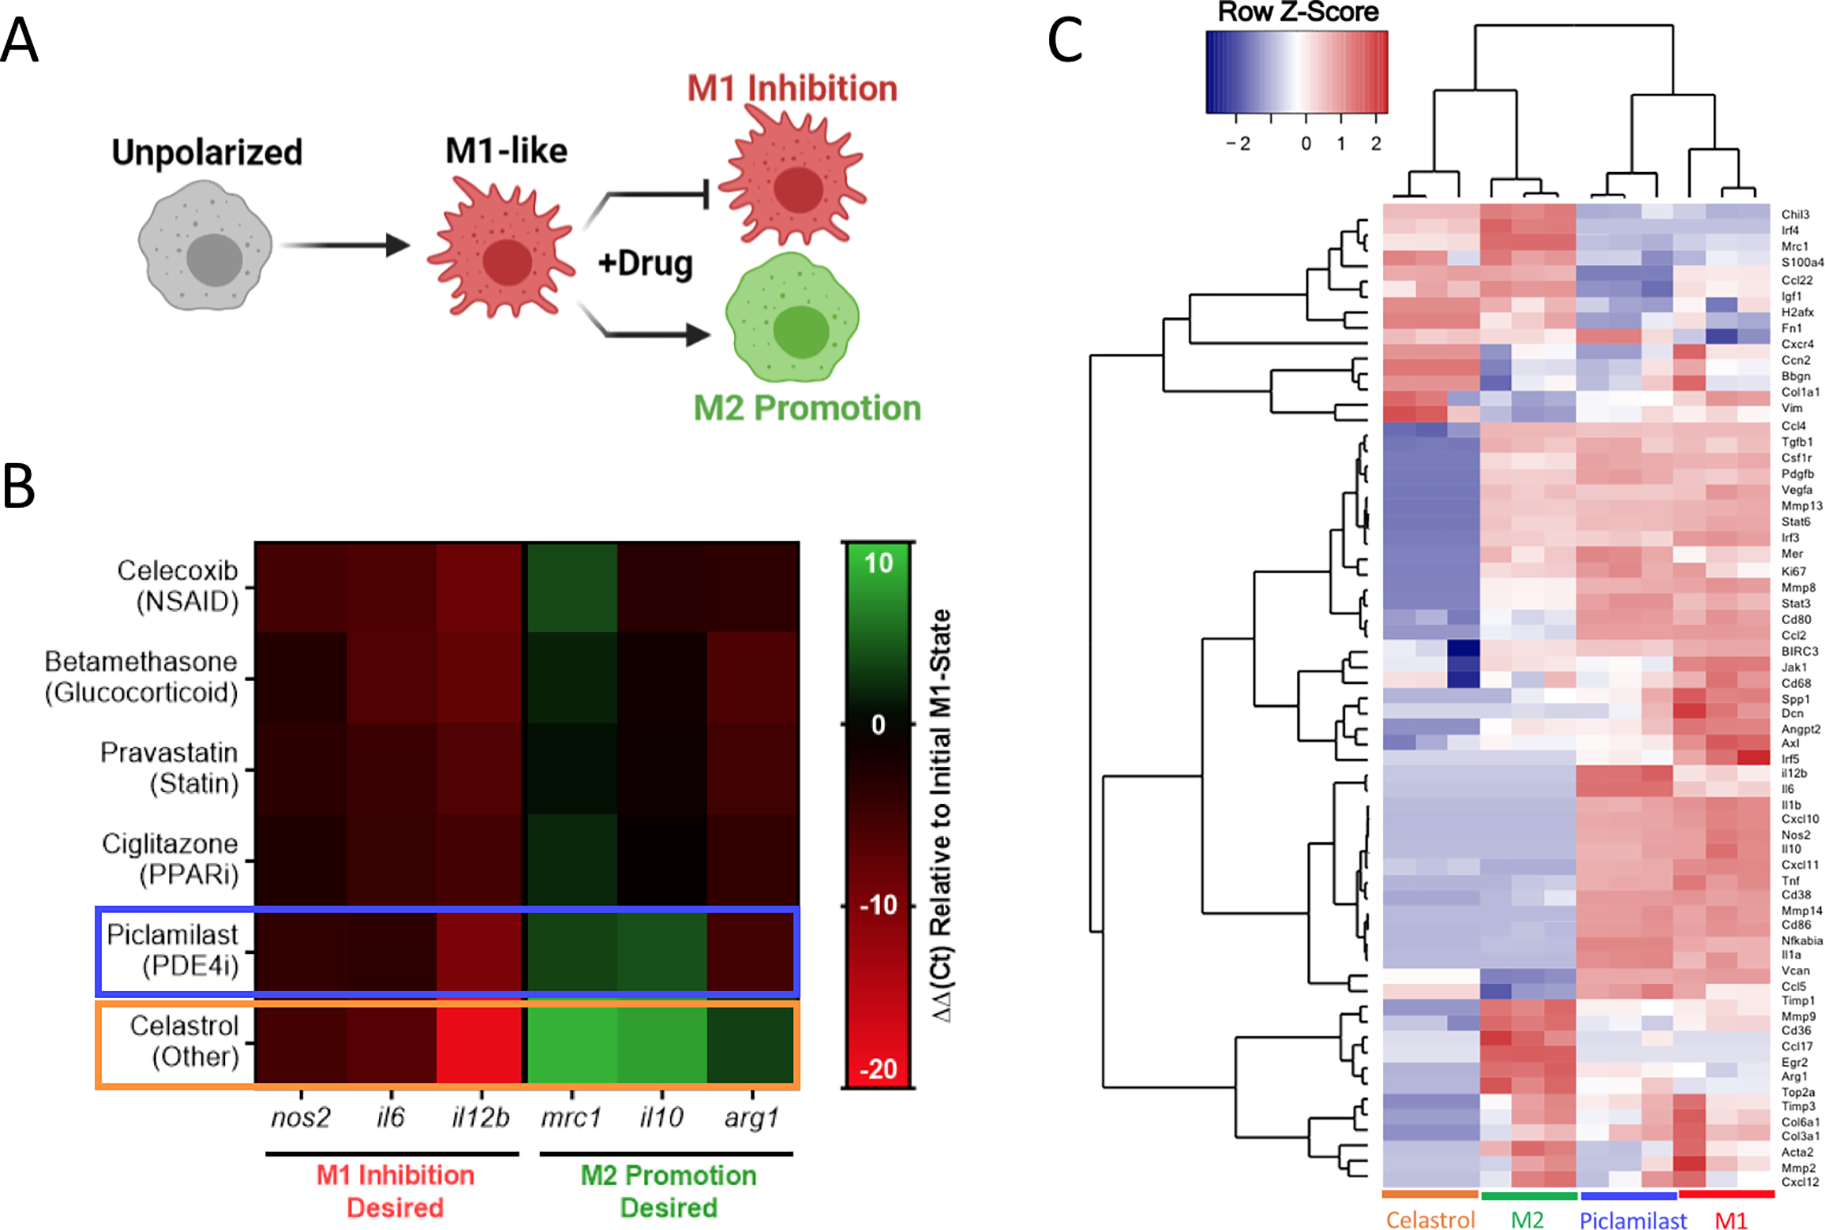
Figure 5. Transcriptional analysis of murine macrophage phenotype.

A) RAW264.7 cells were concurrently treated by zymosan (100 μg/mL) and the indicated drug (1 μM) to identify M1-like inhibition and M2-like promotion for all datasets presented. B) Heat map of gene expression following 24 hrs treatment, expressed as ΔΔCt relative to hprt and zymosan-treated controls. Compounds selected for further evaluation are boxed in blue (piclamilast) and orange (celastrol). Results represent the mean of n = 3, and are normalized to a housekeeping hprt gene, as well as an internal M1-like control. C) Heatmap of nanoString data represented as the row Z-score of log-transformed normalized data. Genes that were not expressed above background are excluded from presentation. Bone Marrow derived macrophages (BMDMs) were subject to celastrol and piclamilast treatment (1 μM) with concurrent stimulation by zymosan (100 μg/mL). M1 and M2 controls are included for reference. Accompanying cluster analysis and dendogram most closely associate celastrol treatment with M2 controls, while piclamilast treatments are intermediate to M1 and M2 control phenotypes.
