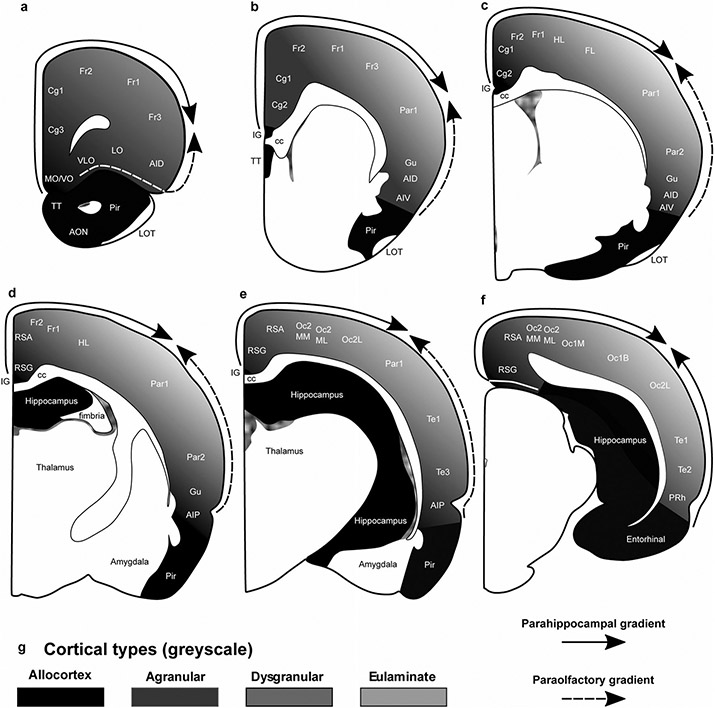
Fig. 3.
Distribution of cortical types across the rat cortex. a–f, Coronal maps of the rat brain according to Zilles (1985). a is the most rostral map and f is the most caudal map. Allocortical areas are colored in black; agranular mesocortical areas are colored with the darkest gray; dysgranular mesocortical and eulaminate areas are colored in progressively lighter grays. g, Grayscale of cortical types in a–f. Cortical areas are indicated according to Zilles (1985); see Table 4 for abbreviations of neocortical areas. AON anterior olfactory nucleus, cc corpus callosum, IG indusium griseum, LOT lateral olfactory tract, Pir piriform cortex, TT taenia tecta. Solid arrows indicate the parahippocampal gradient of laminar differentiation. Dashed arrows indicate the paraolfactory gradient of laminar differentiation

