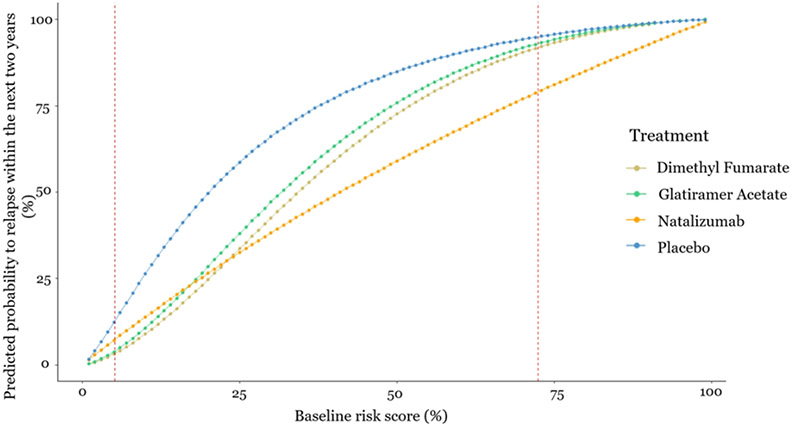
Figure 2/.
Estimated probability to relapse within the next two years as a function of the baseline risk score. The x-axis shows the baseline risk score of relapsing within the next two years and the y-axis shows the estimated probability to relapse within the next two years under each one of the treatments. Between the two dashed vertical lines are the baseline risk values observed in the data used

