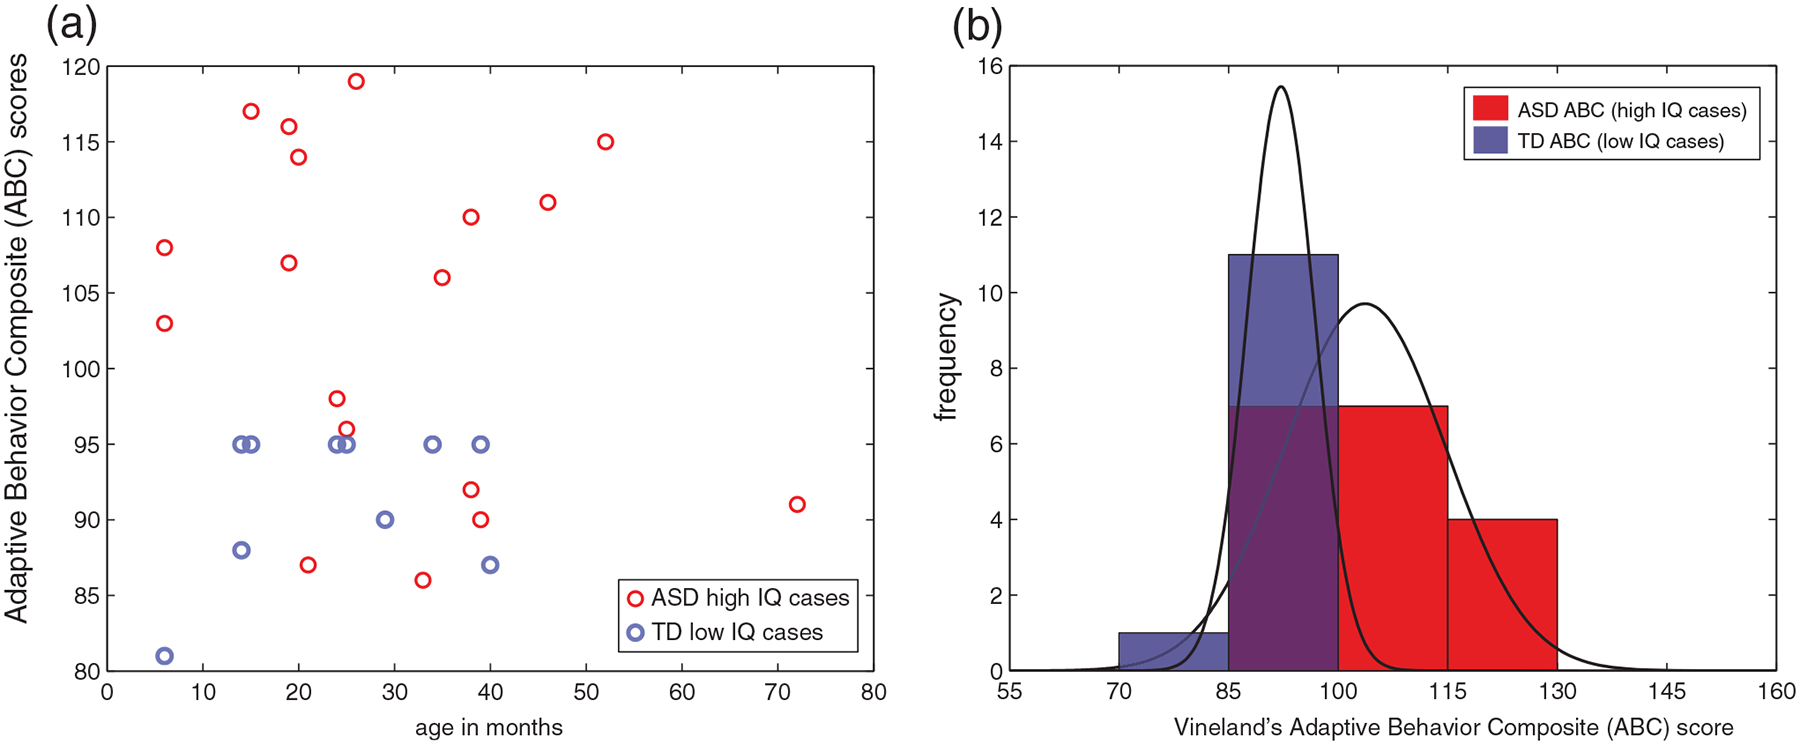
FIGURE 5.

Intelligence quotient (IQ) and adaptive functioning for selected cases. (a) Scatterplot for ASD high IQ cases and TD low IQ cases, (b) same data, shown as frequency and corresponding probability density function (PDFs). Significantly worse adaptive functioning on the Vineland is detected for TD cases with full-scale IQ (ELC) scores below 2SD, relative to ASD cases with ELC scores above 2SD (p < 0.05). ASD, Autism Spectrum Disorder; TD, typically developing; ABC, Adaptive Behavior Composite
