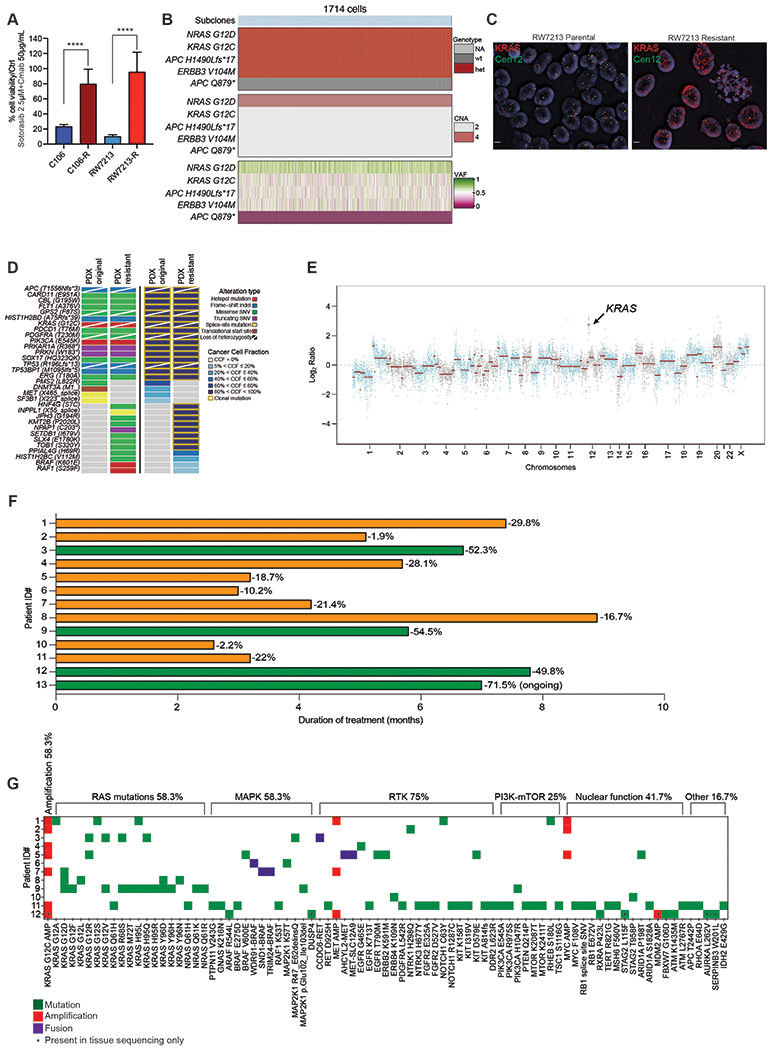
Figure 1. Mechanisms of resistance to combined KRAS G12C and EGFR inhibition in colorectal cancer.

A. Graph showing cell viability of parental and resistant C106 and RW7213 cells. Statistical analyses and P-values represent Mann Whitney Test (T-Test), ****= P-value ≤0.0001. B. Heatmap of KRAS G12C and NRAS G12D alleles detected by single cell sequencing of C106 resistant subline. VAF: variant allelic frequency; GQ: genotyping quality score from GATK; DP: sequencing depth. C. FISH staining for KRAS gene in RW7213 parental and resistant subline. Manual review of parental RW7213 cells indicated no amplification (mean KRAS (red)/Cen12 (green) ratio of 1.1; 50 cells counted) in approximately 90% of the hybridized area and approximately 10% hybridized area with increased KRAS copies (mean red/green ratio of 3.5; 50 cells counted). Mean red/green ratio in the resistant subline, based on manual counting of 20 cells, was 6.4 with >20 KRAS (red) signals in all cells. Scale bars 5μm. D. Nonsynonymous somatic mutations identified by MSK-IMPACT in the CLR-113 original and resistant PDX. Mutation types (left) and cancer cell fraction (CCF) of mutations identified (right) are color coded according to the legend. E. Copy-number alterations (CNAs) of the CLR-113 original and resistant PDX (top). Copy-number log2 ratios are shown on the y-axis according to the chromosomes on the x-axis. The arrow shows KRAS amplification. F. Plot showing duration of response to KRAS G12C inhibitor (adagrasib/sotorasib) plus EGFR inhibitor (cetuximab/panitumumab) by patient ID number. Best response by RECIST is noted at the end of each bar, and partial responses are shaded green and stable disease shaded orange. G. Oncoprint of emergent alterations detected in circulating tumor DNA (ctDNA) of CRC patients at time of radiographic or clinical progression through combined KRAS G12C and EGFR inhibition. Patient 12 had both ctDNA and tumor tissue analyzed at progression, and emergent alterations identified only in tissue are marked with an asterisk.
