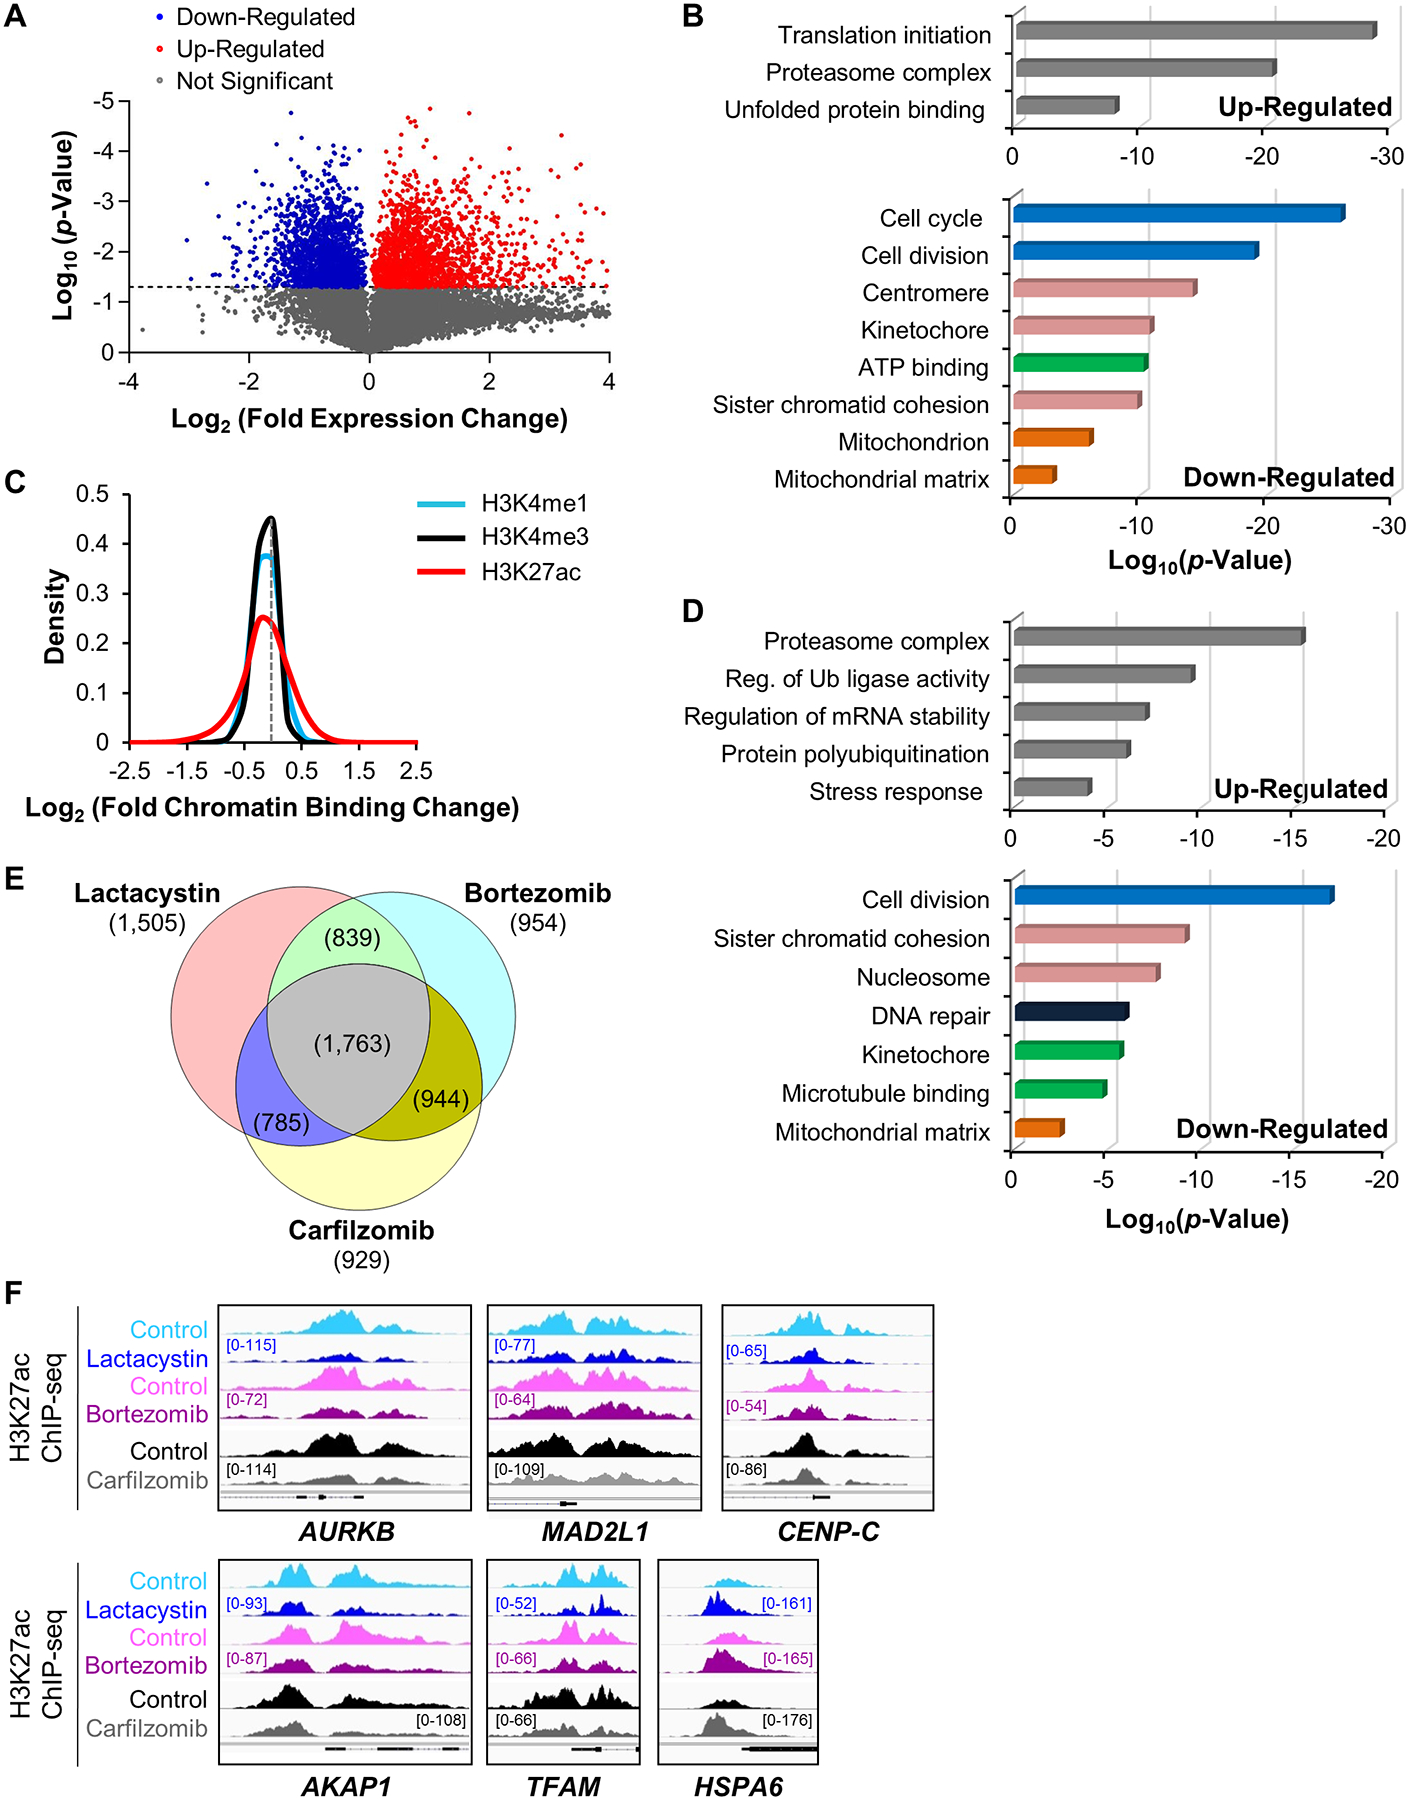
Figure 1. Proteasome inhibition represses H3K27 acetylation and transcription of genes involved in MM growth and metabolism.

A, Volcano plot representation of differential expression analysis of genes in control vs lactacystin-treated MM.1S cells measured by RNA-seq after 6 h treatment. Blue and red dots mark the genes with significantly decreased or increased expression, respectively, in proteasome inhibitor-treated cells compared to control samples. The p-values shown on the y-axis are based on paired Student’s two-tailed t-test.
B, Functional distribution of gene clusters up-regulated (top panel) or down-regulated (bottom panel) by proteasome inhibitor lactacystin as measured by RNA-seq. Differentially expressed RNAs were analyzed for significantly enriched functional annotation terms, as determined by DAVID. Transcription of cell growth and metabolic gene clusters was the most strongly repressed after treatment.
C, Sensitivity of histone marks (H3K4me1, H3K4me3, and H3K27ac) to proteasome inhibitor lactacystin (3 h treatment). Data show that the H3K27ac histone mark is more sensitive to proteasome inhibitor than H3K4me1 and H3K4me3 marks. Data are represented as log2 fold change (lactacystin-treated versus control) of significantly enriched ChIP-seq peaks for the three studied histone modifications and are representative of two independent experiments. The gray dotted line intersects the x-axis at zero (no change).
D, Functional distribution of gene clusters up- or down-regulated after 3 h treatment with proteasome inhibitor lactacystin. Gene activities (H3K27ac mark) that were up-regulated (top panel) or down-regulated (bottom panel) after lactacystin treatment were analyzed for significantly enriched functional annotation terms, as determined by DAVID. Data are representative of two independent experiments. Reg., regulation; Ub, ubiquitin.
E, Venn diagram showing the overlap of repressed H3K27 acetylation sites within 1 kb of transcription start site in MM.1S cells treated with lactacystin, bortezomib, or carfilzomib. 1,763 genes showed repressed H3K27 acetylation with all three treatments.
F, H3K27 acetylation was rapidly repressed in cell cycle (AURKB, MAD2L1, CENP-C), mitochondrial (AKAP1, TFAM), and stress response (HSPA6) gene promoters following treatment with lactacystin, bortezomib, and carfilzomib in MM.1S cells. In contrast, the stress response gene HSPA6 displayed elevated H3K27 acetylation levels, indicating that the response to proteasome inhibition is gene-specific. The gene structure is shown in black at the bottom of each panel. All Integrative Genomics Viewer (IGV) ChIP-seq tracks in a given comparison are represented at the same scale (numbers in brackets at the y-axis). The genomic region on the x-axis spans 2.5 kb for all the regions. Images are representative of two independent experiments.
