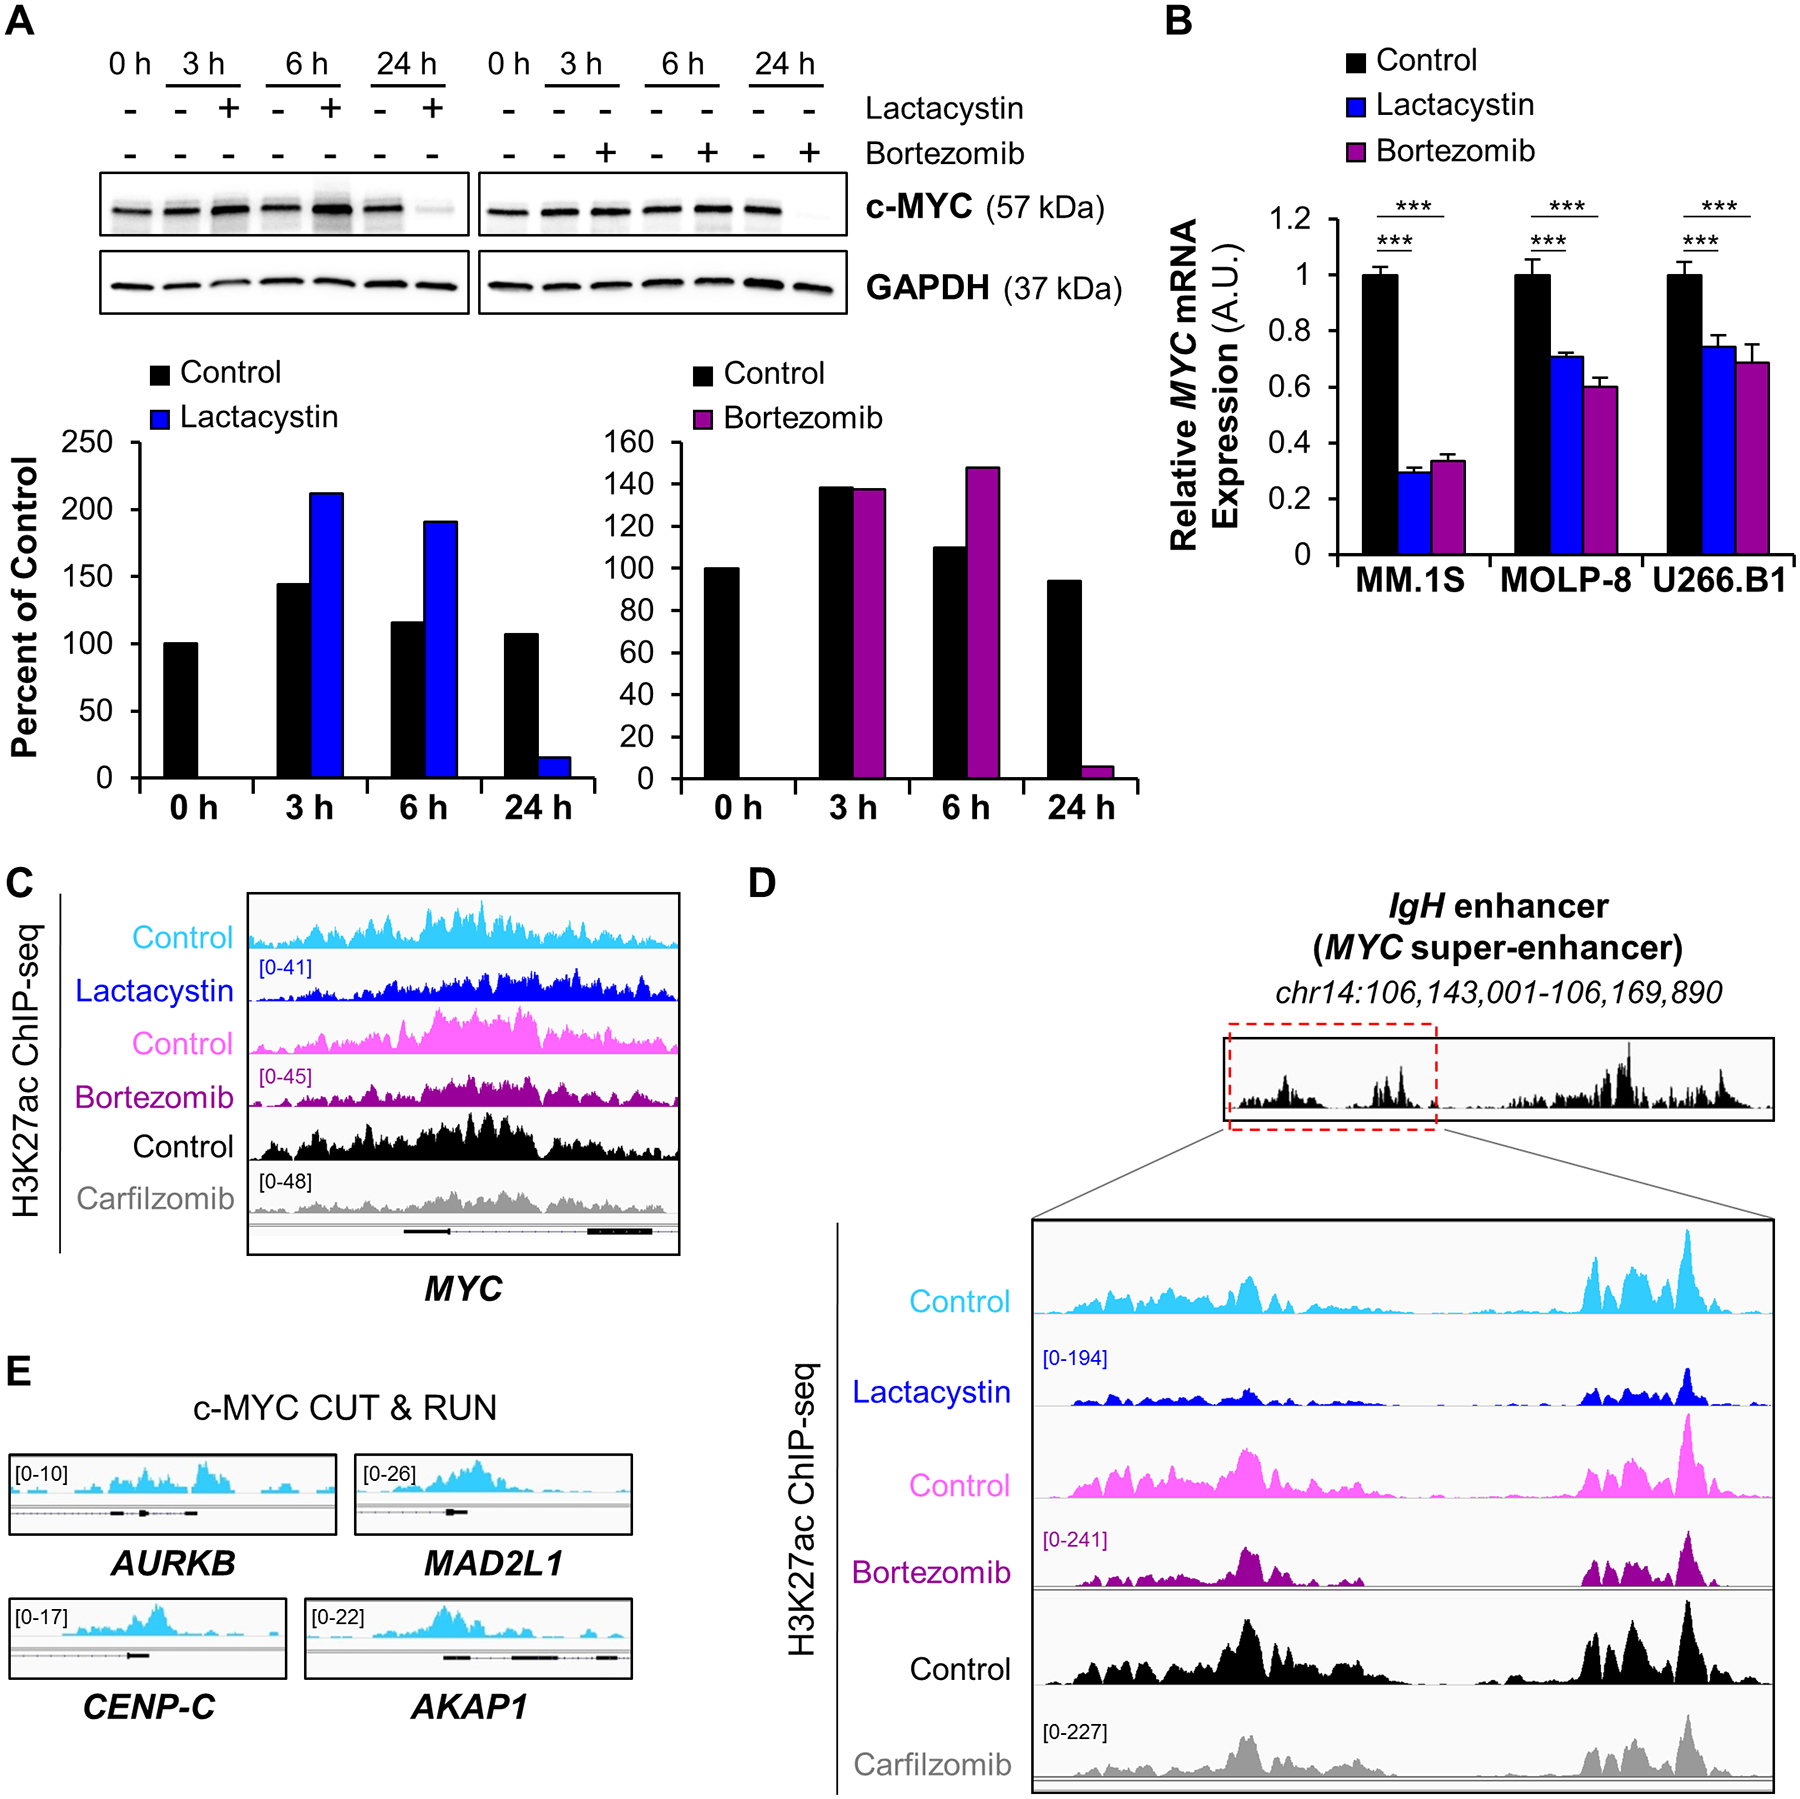
Figure 2. Proteasome inhibitors repress c-MYC gene expression and induce chromatin condensation at the c-MYC super-enhancer.

A, Western blot analysis of c-MYC protein levels in MOLP-8 cells shows the biphasic effect of proteasome inhibitor treatment (12.5 μM Lactacystin; 30 nM Bortezomib) on c-MYC protein levels over time (3 h, 6 h, and 24 h). Glyceraldehyde 3-phosphate dehydrogenase (GAPDH) was used as an internal control. The relative expression of c-MYC protein was quantified in ImageJ and normalized to that of GAPDH protein. The levels of c-MYC protein at each timepoint were densitometrically compared and expressed as percent of the untreated 0 h time point. Degradation of c-MYC at later timepoints can be attributed to incomplete inhibition of the proteasome and a bortezomib half-life of about 12 h.
B, RT-qPCR measurement of MYC mRNA levels in MM.1S, MOLP-8 and U266.B1 cells demonstrates that lactacystin or bortezomib transcriptionally repress the c-MYC oncogene after 6 h treatment. ***p<0.001 determined by unpaired Student’s two-tailed t-test.
C, Representative ChIP-seq tracks of H3K27ac sites on MYC gene following exposure of MM.1S cells to different proteasome inhibitors show that H3K27 acetylation at the c-MYC promoter was rapidly repressed after treatment. The gene structure is shown in black at the bottom of the panel. IGV tracks in a given comparison are represented at the same scale (numbers in brackets at the y-axis). The genomic region on the x-axis spans 5 kb of the MYC gene. IGV snapshots are representative of two independent experiments.
D, Gene tracks of H3K27ac ChIP-seq occupancy at c-MYC super-enhancer in MM.1S cells show that exposure to lactacystin, bortezomib, and carfilzomib reduces H3K27 acetylation of the super-enhancer, especially at its 5’-end (red dashed box). IGV tracks in a given comparison are represented at the same scale (numbers in brackets at the y-axis). The genomic region on the x-axis spans 9 kb of the c-MYC super-enhancer. IGV snapshots are representative of two independent experiments.
E, CUT & RUN gene tracks of c-MYC binding sites in MM.1S cells. The genomic region on the x-axis spans 2.5 kb for all the genes. IGV snapshots were the result of a single CUT & RUN experiment.
