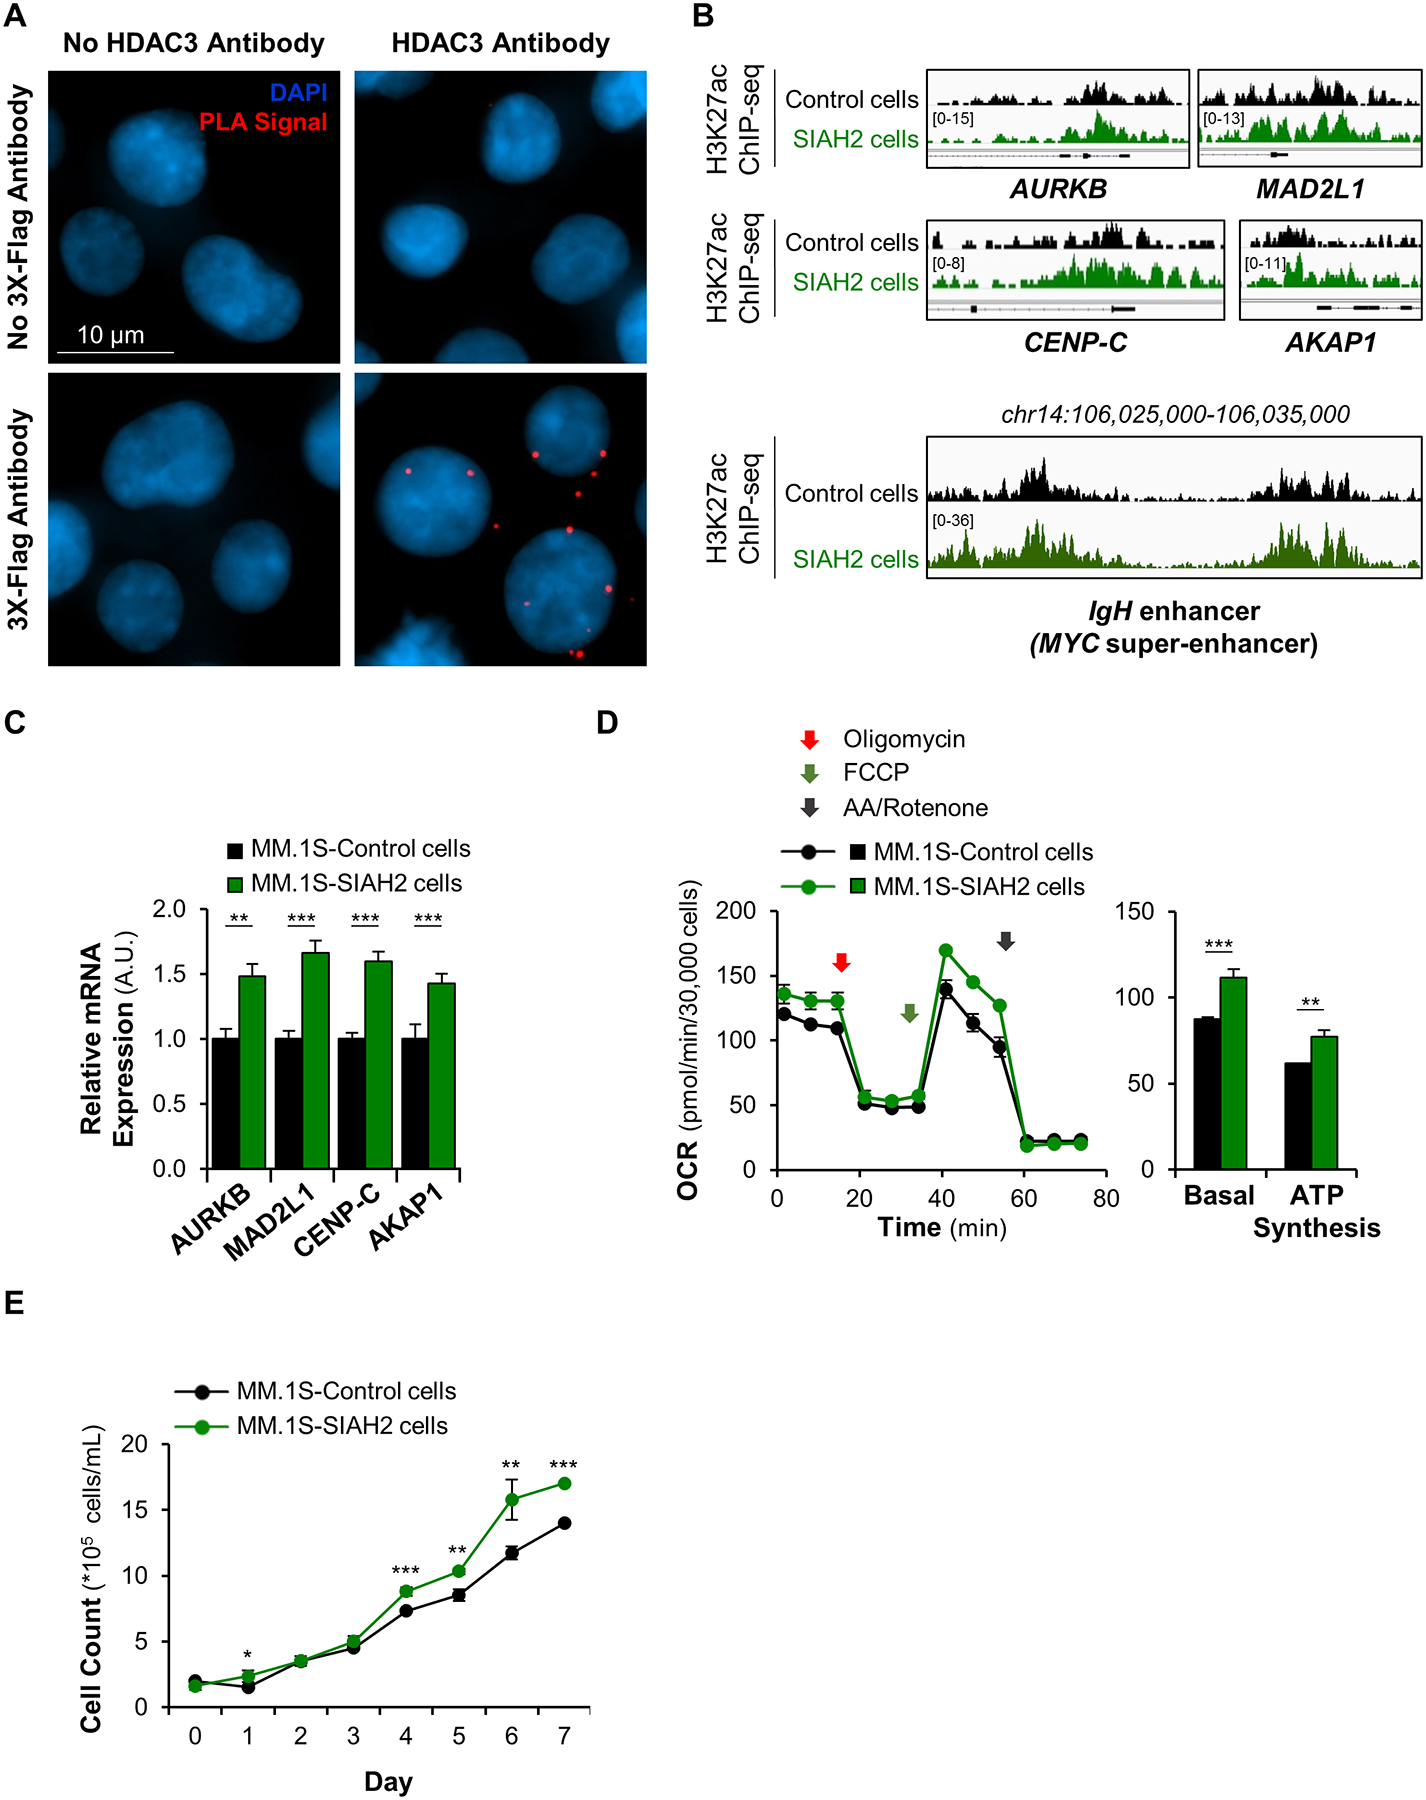
Figure 5. The Seven In Absentia Homolog 2 (SIAH2) ubiquitin ligase antagonizes HDAC3-mediated repression in MM cells.

A, Detection of HDAC3-SIAH2 interactions by proximity ligation assay (PLA) in MM.1S-3xFlag-tagged SIAH2 cells cultured in presence of 0.5 μM lactacystin to prevent auto-degradation of the instable ubiquitin ligase (54). Nuclei are shown stained blue with DAPI and PLA signals represented as red dots.
B, Representative IGV browser ChIP-seq tracks of H3K27ac peaks at the promoter of cell cycle and mitochondrial genes and the c-MYC super-enhancer show up to 2-fold increased H3K27 acetylation in the MM.1S-SIAH2 overexpressing cell line. The IGV tracks are represented at the same scale (numbers in brackets at the y-axis). For the four gene top panels, the gene structure is shown in black at the bottom of each panel and the genomic region on the x-axis spans 2.5 kb. IGV snapshots are representative of two independent experiments.
C, RT-qPCR analysis of HDAC3 target genes shows increased transcription in MM.1S-SIAH2 overexpressing cells. ***p<0.001, **p<0.01, and *p<0.05 determined by unpaired Student’s two-tailed t-test.
D, Measurement of mitochondrial respiration in MM.1S-SIAH2 overexpressing cells. Basal OCR values and ATP synthesis were measured as described in Fig. S3D legend. ***p<0.001 and **p<0.01 determined by unpaired Student’s two-tailed t-test.
E, Cell growth curves show that SIAH2-overexpressing MM.1S cells proliferate faster than control cells over a period of 8 days. ***p<0.001, **p<0.01, and *p<0.05, SIAH2 group compared to control group, determined by unpaired Student’s two-tailed t-test. Cell viability was not affected by SIAH2 overexpression.
