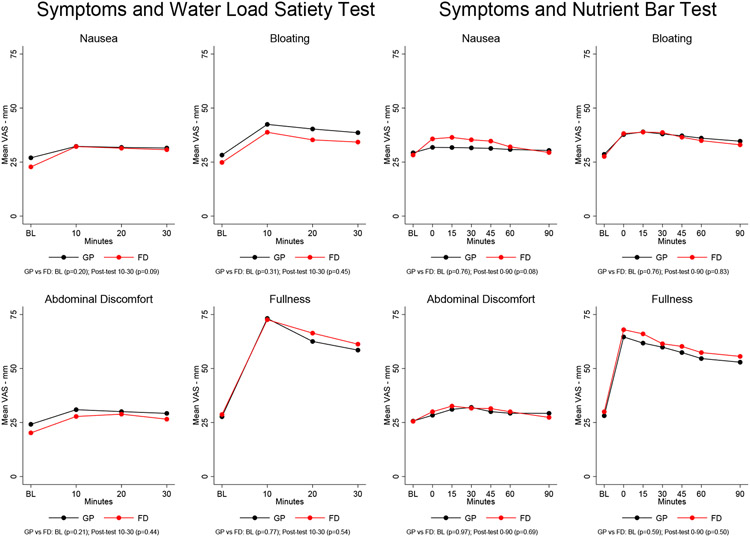
Figure 2.
Symptoms before and after the water load satiety test and nutrient bar test are shown. Symptoms were scored on a visual analog scale from 0-100 for each symptom. BL indicates the time 15 min before ingestion of the water and 0 represents symptoms immediately after ingestion of the nutrient bar. Symptoms increased after the water load in both groups, but there were no significant differences in intensity between the GP and FD groups. Symptoms before and after ingestion of the nutrient bar test meal were similar in the GP and FD groups.

