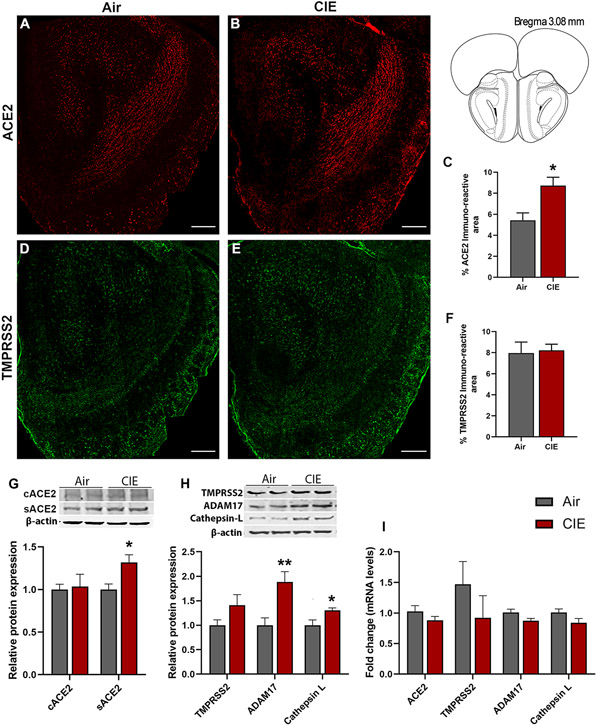
Figure 1: Effect of chronic intermittent ethanol (CIE) exposure on the ACE2, TMPRSS2, ADAM17, and Cathepsin L expression in the olfactory bulb (OB).
(A-B) Representative confocal images of ACE2 positive cells in OB of air control and CIE mice. Scale bar = 200 μm (C) Histogram represents the % ACE2 immunoreactive area in OB. (D-E) Representative confocal images of TMPRSS2 in OB of air control and CIE mice. Scale bar = 200 μm. (F) Histogram showing the % TMPRSS2 immunoreactive area in OB. (G) Representative Western blot (WB) and histogram showing the cACE2 and sACE2 protein levels in the OB. (H) Representative WB and histogram showing the TMPRSS2, ADAM17, and Cathepsin L protein levels in the OB. (I) Histogram showing the ACE2, TMPRSS2, ADAM17, and Cathepsin L mRNA levels in the OB. Values (n = 4 - 5/group for IF and n = 7-8/group for WB and RT-qPCR) are represented as means (±SEM) and the data was analyzed by unpaired student’s t-test with Welch’s correction (*p < 0.05, **p < 0.01, versus air control).

