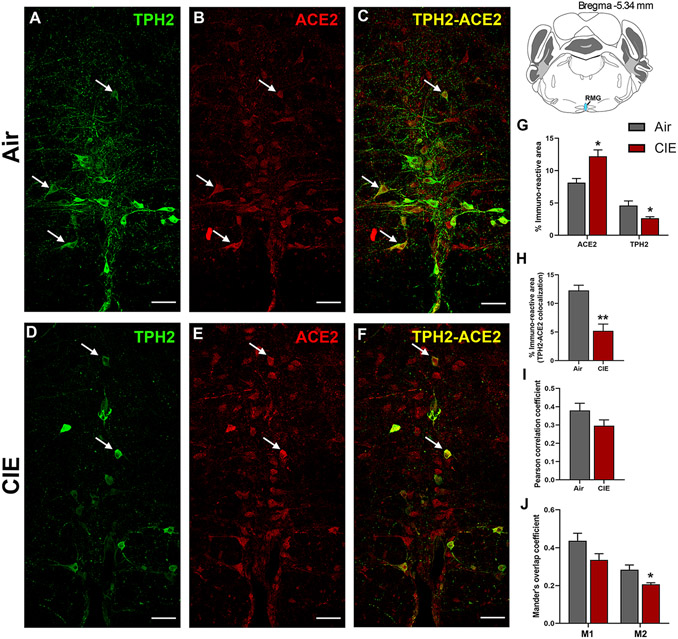
Figure 4: Effect of chronic intermittent ethanol (CIE) exposure on the TPH2 and ACE2 immunoreactivity in raphe magnus (RMG).
Representative confocal images showing (A and D) TPH2 (green) (B and E) ACE2 (red) (C and F) TPH2-ACE2 (yellow) positive neurons in RMG of air and CIE mice. Scale bar = 50 μm. Graph showing (G) % immunoreactive area for ACE2 and TPH2, (H) % immunoreactive area for TPH2-ACE2 positive neurons, (I) Pearson correlation coefficient for TPH2-ACE2 colocalization (J) Mander’s overlap coefficient for TPH2-ACE2 colocalization in RMG. Values (n = 4 - 5/group) are represented as means (±SEM) and the data was analyzed by unpaired student’s t-test with Welch’s correction (*p < 0.05, **p < 0.01 versus air control).

