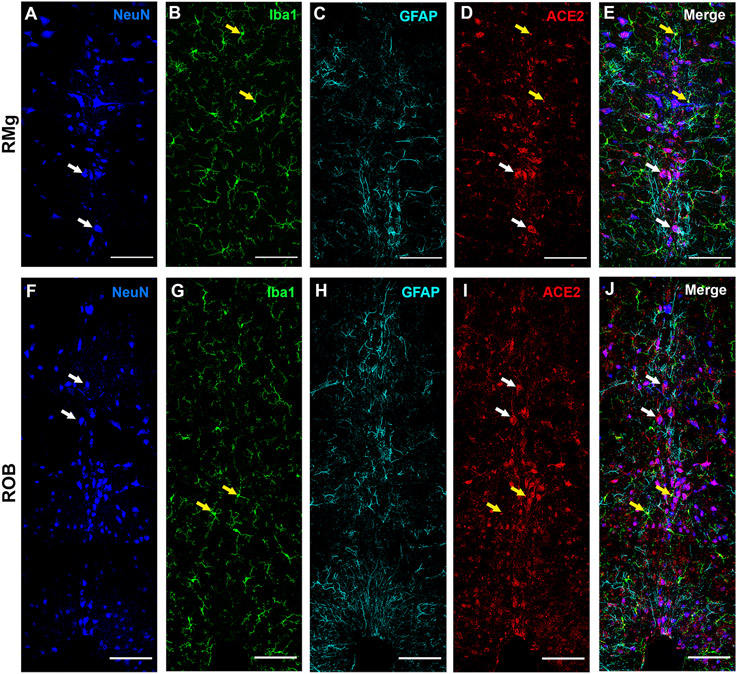
Figure 9: ACE2 distribution in neurons, microglia, and astrocyte in medullary raphe nuclei.
The raphe magnus (RMG), and raphe obscurus (ROB) were stained for neuronal marker NeuN (panel A, F); microglia marker Iba1 (panel B, G); astrocyte marker GFAP (panel C, H) and ACE2 (panel D, I). Panel E shows the merged image of the RMG stained with all the markers (panels A-C) with ACE2 (panel D). Panel J shows the merged image of the ROB stained with all the markers (panels F-H) with ACE2 (panel I). Yellow arrows indicate the colocalization of ACE2 and Iba1 (yellow in the merge panels) and white arrows indicate the colocalization of ACE2 and NeuN (magenta in the merge panels). Scale bar = 100um.

