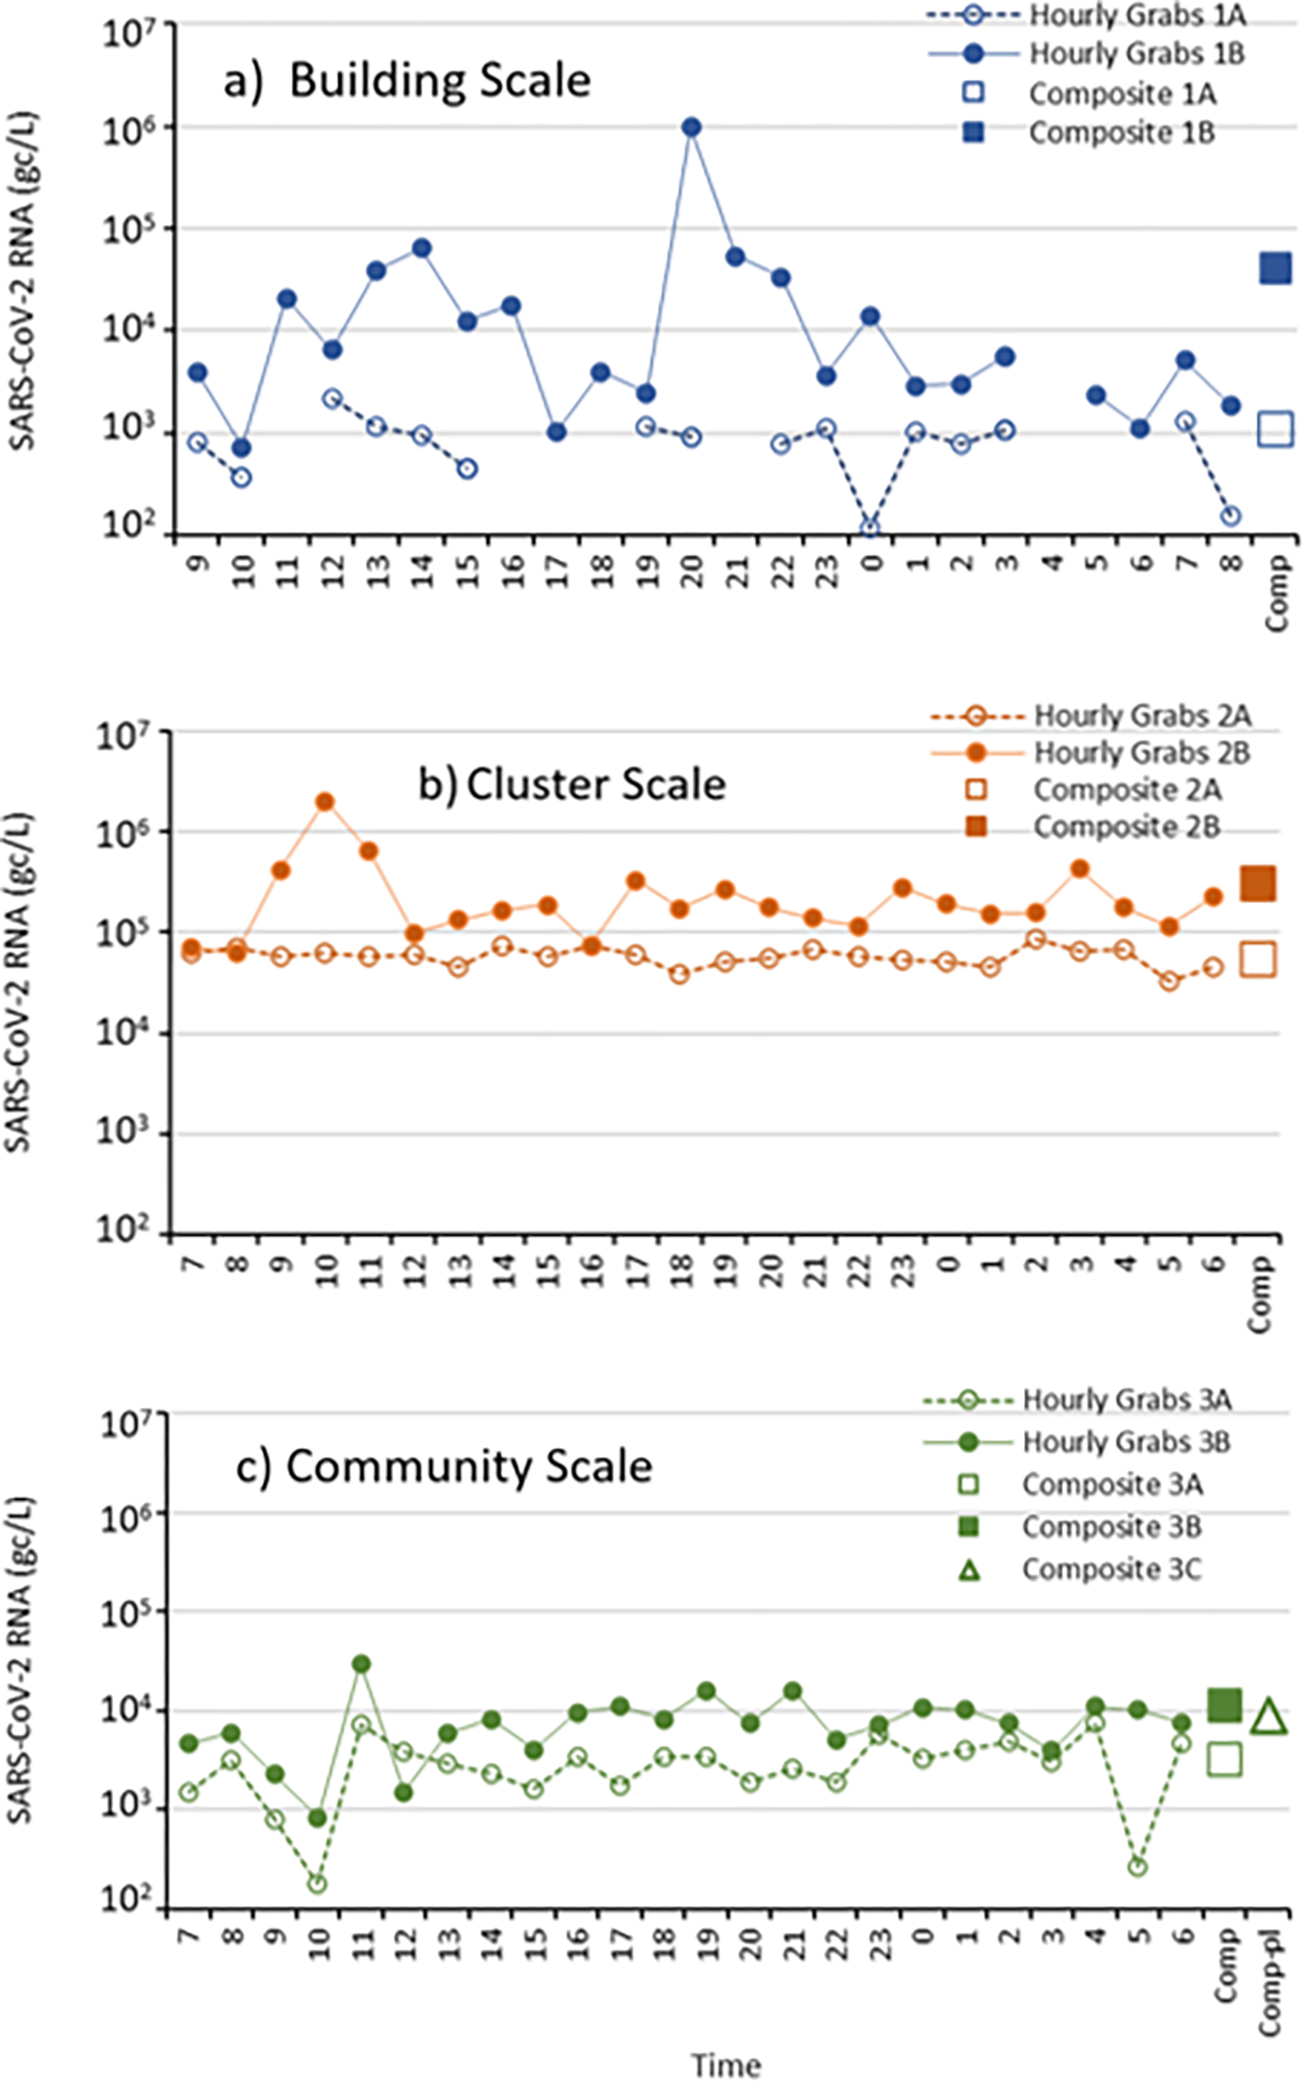
Figure 3:

Time series plots of SARS-CoV-2 for hourly grab samples and composite samples at the building scale (panel a), cluster scale (panel b) and community scale (panel c). Time shown corresponds to local time the day of the hourly experiment. Composite 3C corresponds to the composite sample collected at the wastewater treatment plant and this sample corresponds to mid-night to mid-night the prior day.
