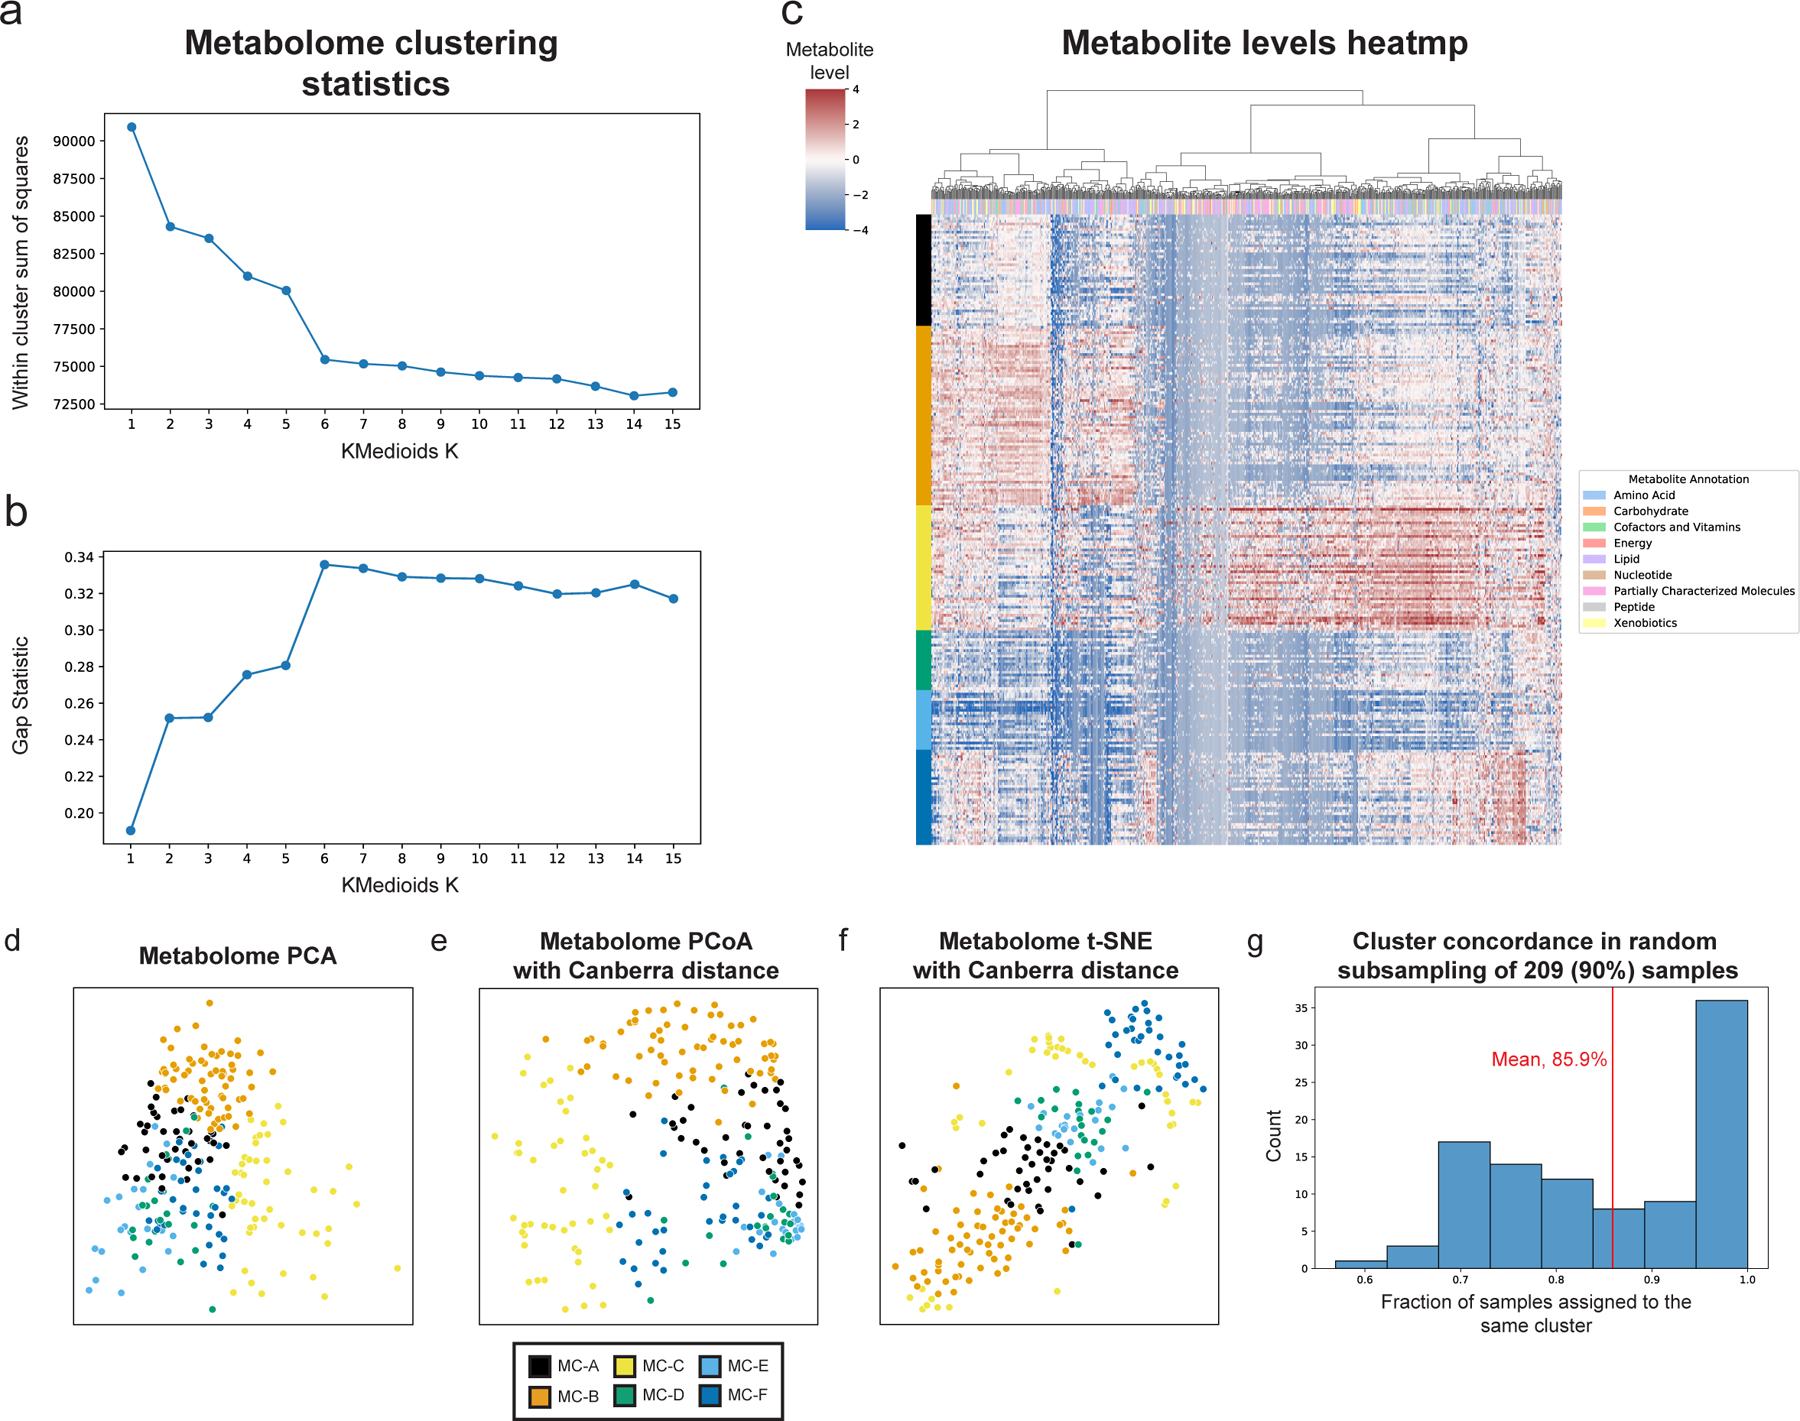
Extended Data Figure 3 |. Characteristics of metabolite clusters.

a,b, Within cluster sum of squared distances (a) and gap statistic (b) for k-medoids clustering using Canberra distances with k from 1 to 15. A shoulder (a) and peak (b) are visible for k=6. c, Heatmap showing metabolite levels for each subject (rows) and metabolite (columns). Subjects are sorted by their assigned metabolites cluster (MC) and metabolites are clustered hierarchically using Canberra distance and Ward linkage. The color above each column reflects metabolite annotations (legend to the right). d-f, Same as Fig. 1c, using PCA (d), Canberra distance-based PCoA (e) and t-SNE (f). g, Histogram of consistency of MC assignment, defined as the fraction of samples assigned to the same MC (x-axis) in 100 iterations in which we randomly selected 90% (209 women) of the cohort, and generated 6 metabolite clusters de novo. The analysis shows that many of the iterations (36 iterations, 36%) had over 95% consistency, with an overall mean consistency of 86%.
