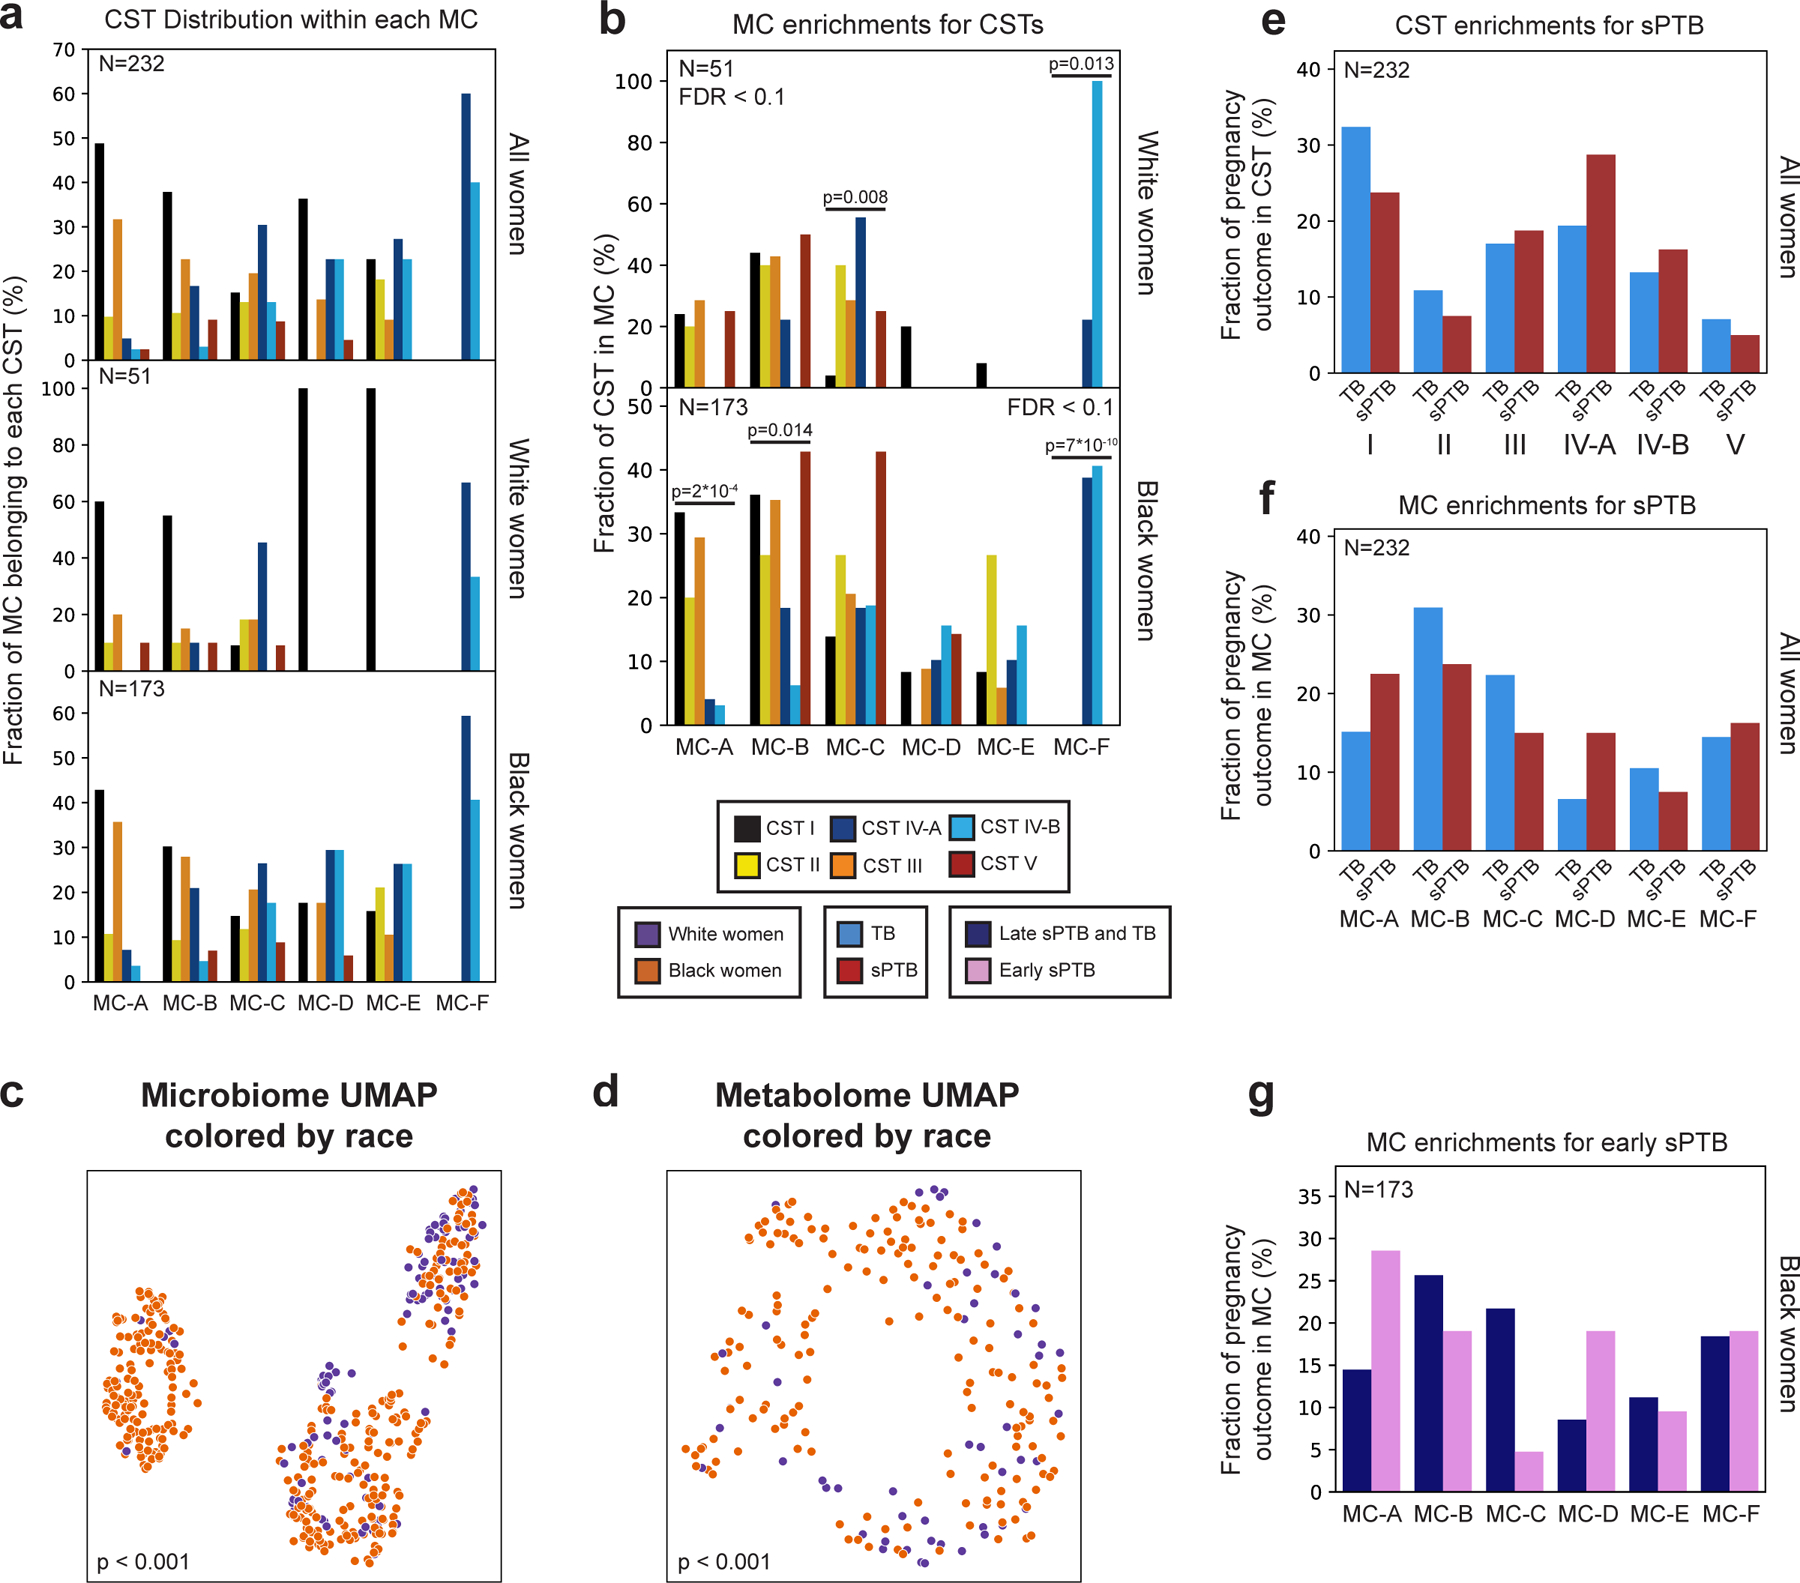
Extended Data Figure 4 |. Metabolite clusters correspond to CSTs.

a, Distribution of CSTs within each metabolite cluster, for all (top; N=232), White (middle; N=51) and Black (bottom; N=173) women. Each group of bars corresponds to a single metabolite cluster and bars within a group sum to 100%. b, Same as Fig. 1d, stratified by race. p - two-sided Fisher’s exact p-values, q<0.1. c,d, Same as Fig. 1b,c, colored by maternal race. p - PERMANOVA. e,f, Same as Fig. 1f,g, performed for all women combined. g, Same as Fig. 1g, for association with early sPTB (gestational age at birth < 32).
