
Figure 1.
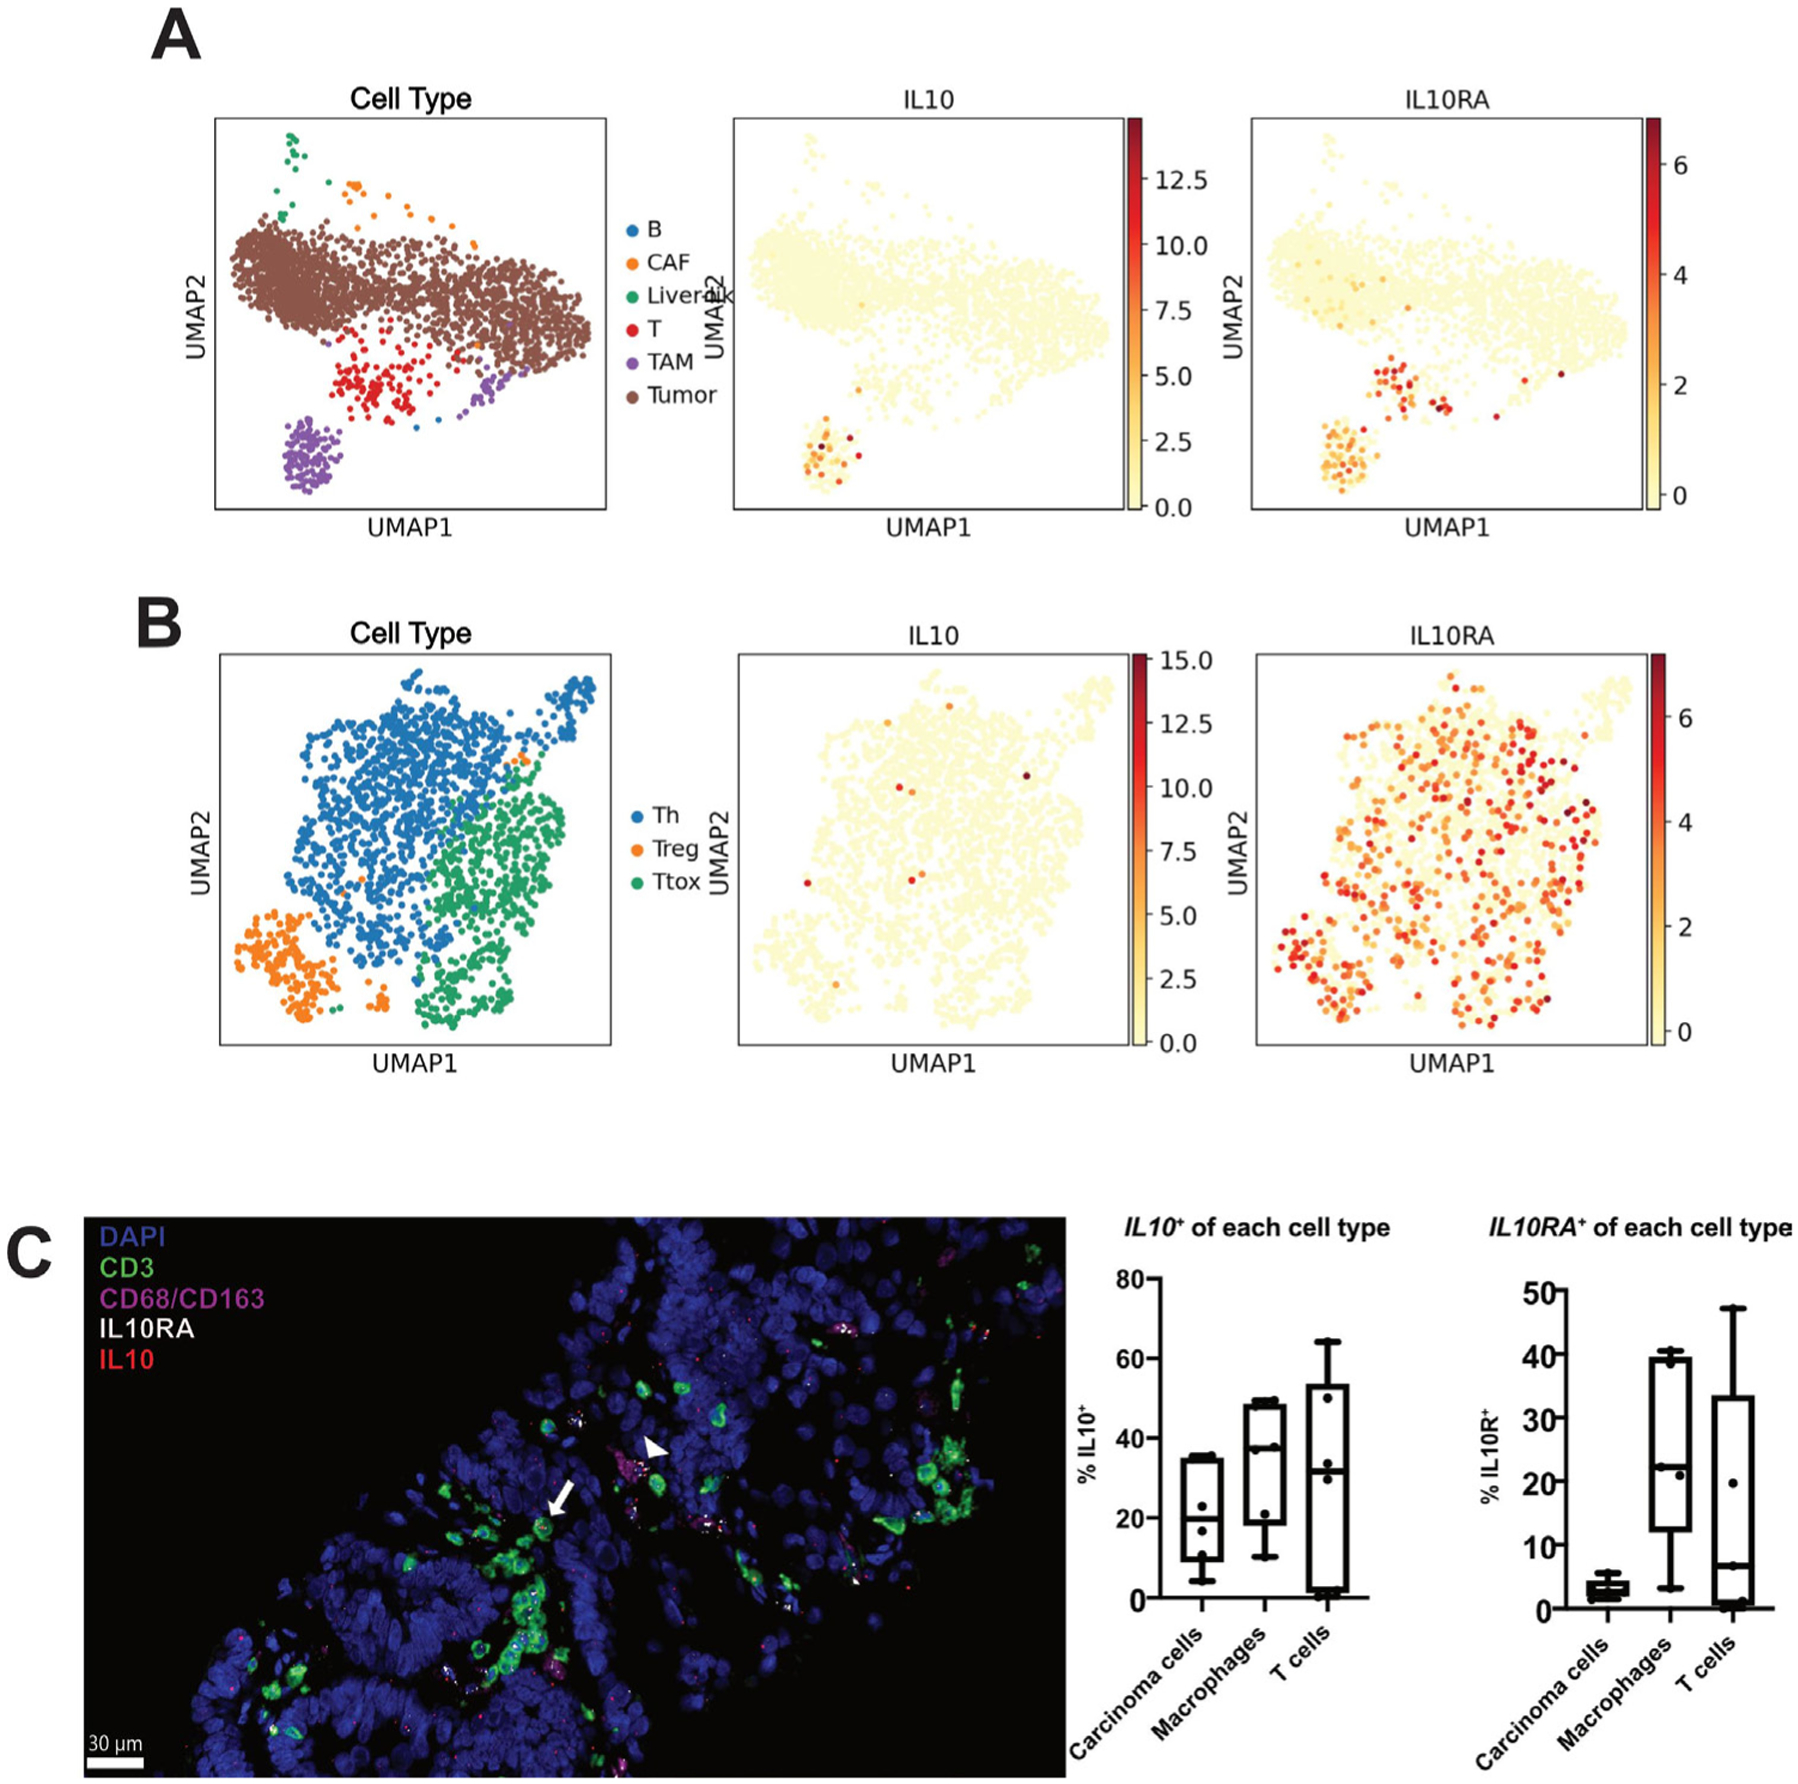
Interleukin 10 (IL-10) is produced by carcinoma cells, macrophages and T cells. (A) UMAP plots of all cell clusters of single cell RNA sequencing (scRNAseq) data from n=3 colorectal cancer liver metastases (CRLM) tumours. TAM, tumour-associated macrophages (purple); CAF, cancer-associated fibroblasts (orange); B cells (blue); liver-like cells (green); T cells (red); tumour cells (brown). IL10 and IL10RA expression highlighted in red/orange. (B) UMAP plots of T cell cluster of scRNAseq data from n=3 CRCLM tumours. Th, helper T cells (blue); Ttox, cytotoxic T cells (green); Treg, regulatory T cells (orange). IL10 and IL10RA expression highlighted in red/orange. (C) Multiplex immunohistochemistry was performed for T cells (CD3, green), macrophages (CD68/CD163, pink) and nuclei (DAPI, blue) with additional in situ hybridisation for IL10 (red) and IL10RA (white). A representative image with IL10+ IL10RA+macrophage (white arrowhead) and IL10+ IL10RA+T cell (white arrow) is shown. Quantification of the proportion of IL10+ and IL10+ cells within each cell type is also shown (n=5 patient tumours). Scale bar=30 μm. Data points represent each human tumour sample.