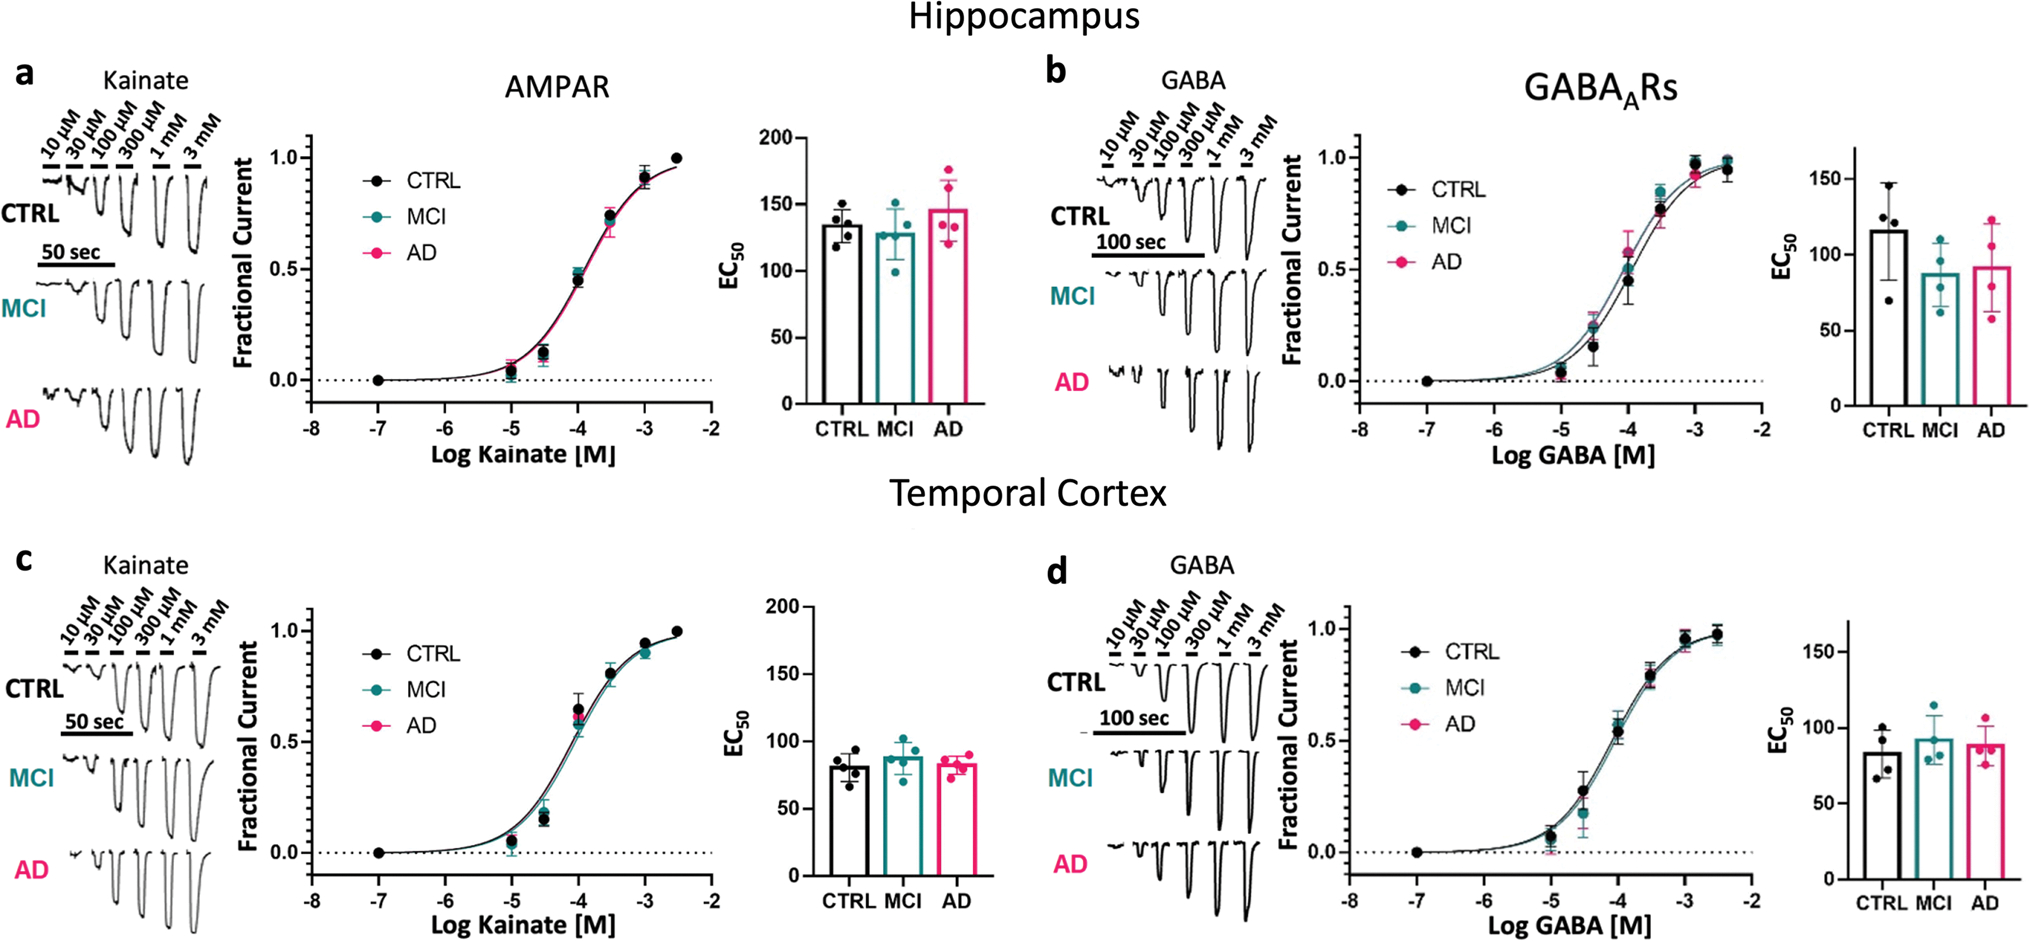
Fig. 2.

Preservation of synaptic receptor affinity. a, c, left, Representative recording of currents elicited by different concentrations of kainate on oocytes microtransplanted with pooled synaptosome fractions from the hippocampus and TCx of CTRL (hippocampus, n = 8; TCx, n = 6 donors), MCI (hippocampus, n = 8; TCx, n = 6 donors) and AD (hippocampus; n = 11; TCx n = 6 donors). a, c, Center, kainate-activating AMPAR concentration–current response relationships (hippocampus, n = 5 oocytes and TCx, n = 5 oocytes). a, c, Right, EC50 obtained from the AMPAR concentration–response curve did not show differences in the hippocampus (F (2, 12) = 1.16, p = 0.35) or TCx (F (2, 12) = 0.64, p = 0.55). b, d, Left, currents elicited by different concentrations of GABA on oocytes microtransplanted with the same pool of synaptosome preparations described above. b, d, Center, GABA-activating GABAAR concentration–current response relationships (hippocampus, n = 4 oocytes; TCx, n = 4 oocytes). b, d, Right, EC50 for GABA was not different in the hippocampus (F (2, 9) = 0.37, p = 0.70) or TCx (F (2, 9) = 1.22, p = 0.34). For all figures, the oocyte membrane potential was held at −80 mV. Data were collected from two independent experiments, and all values were normalized to the maximum (see details in Supplementary dataset 5, online resource). Whiskers from each dose point represent standard deviations
