Fig. 3.

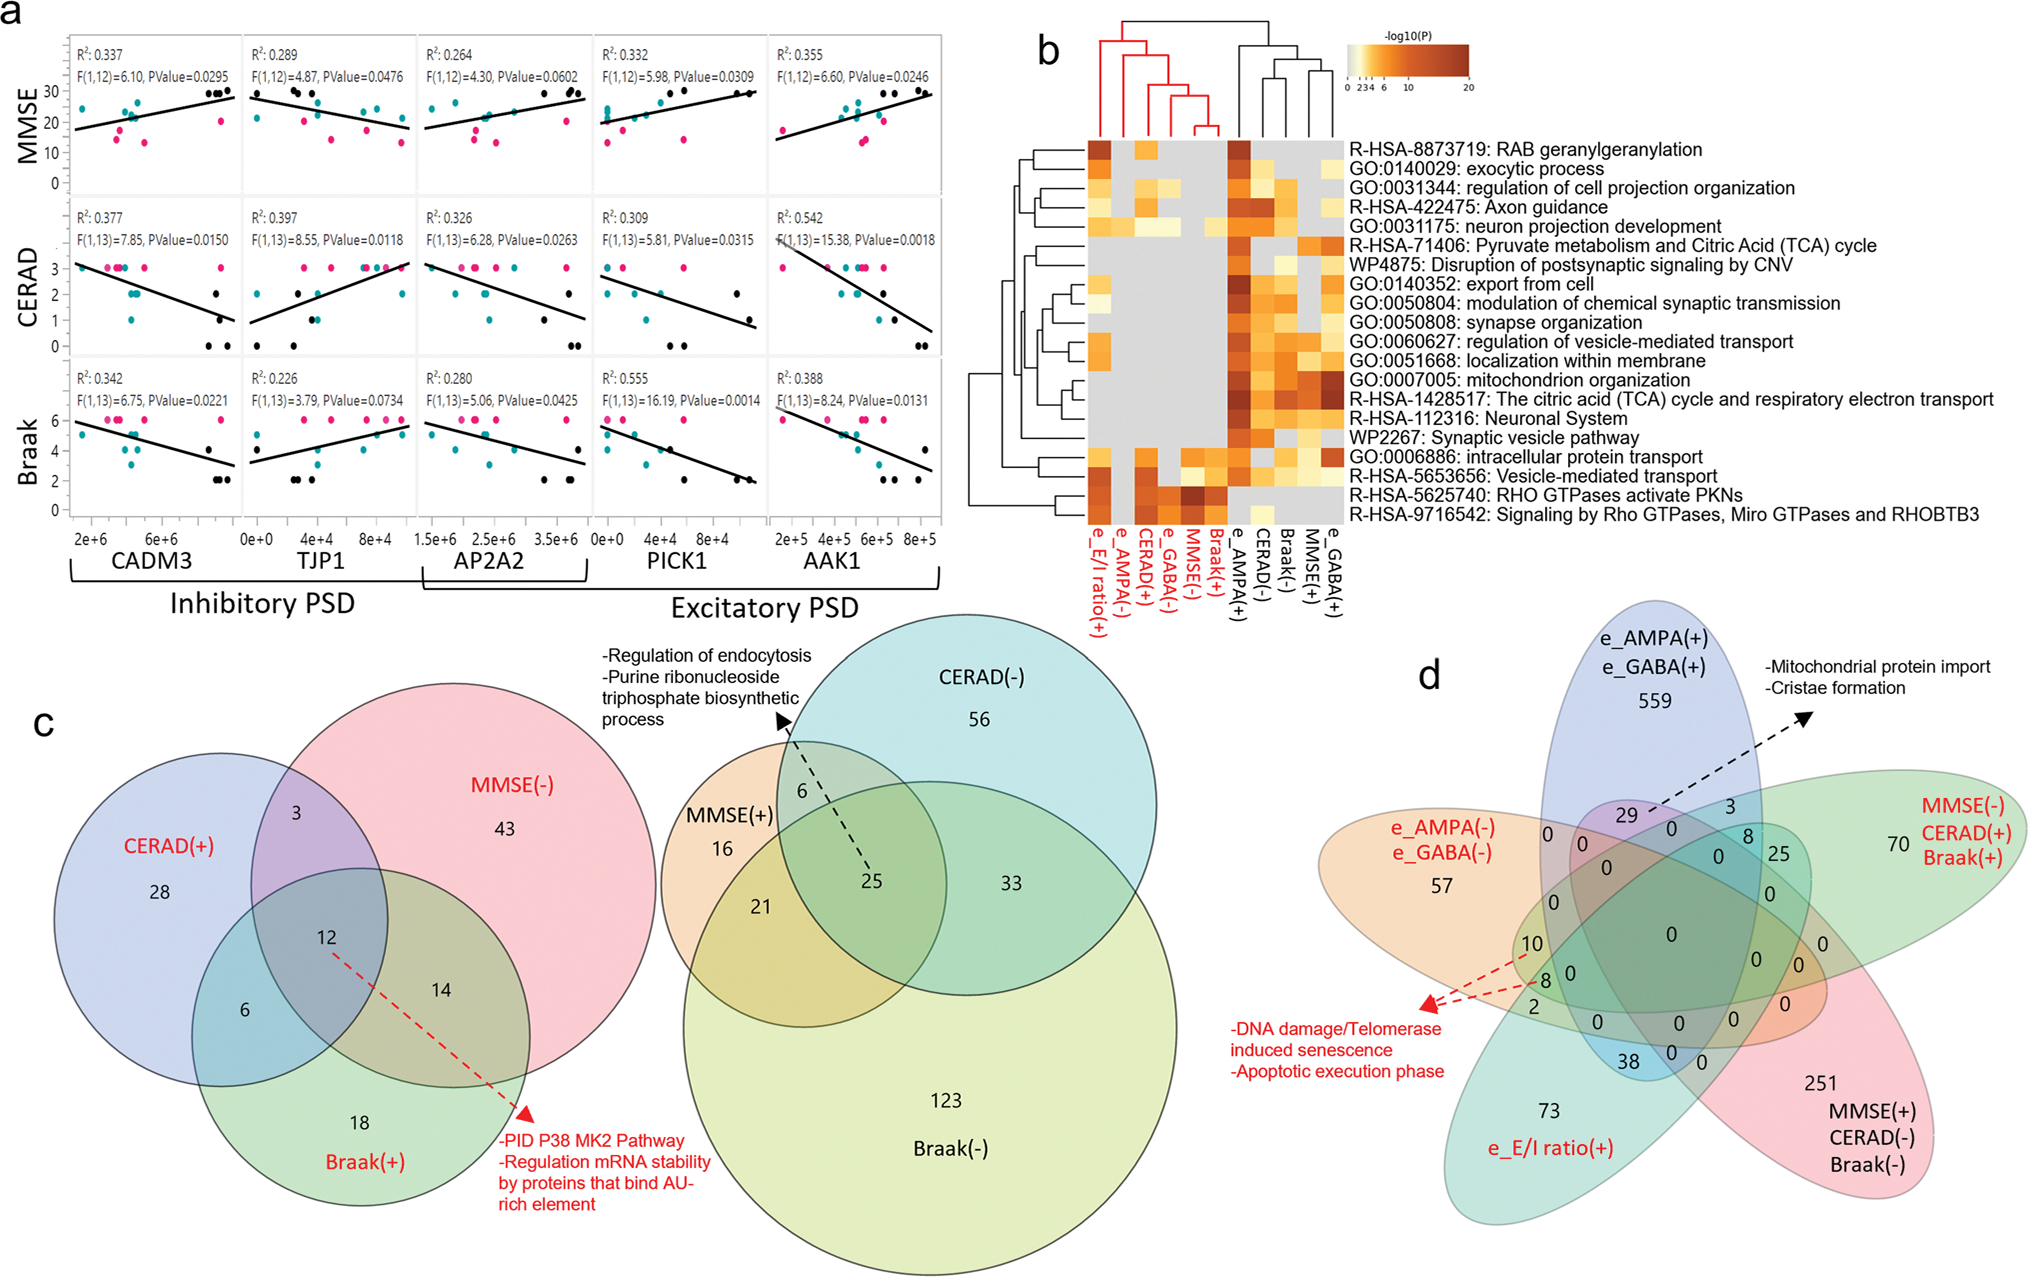
The eE/I ratio correlates with neuropathology severity. a Linear correlations between inhibitory and excitatory postsynaptic density proteins (PSD) with MMSE scores and severity of AD pathology (Braak stage, CERAD) from CTRL (n = 4, black dots), MCI (n = 6, aqua dots) and AD (n = 6, magenta dots) donors. b Heatmap showing the top enrichment clusters, one row per cluster, using a discrete color scale to represent statistical significance. Gray color indicates a lack of significance. Metascape GO enrichment analysis of synaptic proteomics that correlate positively (+) or negatively (−) with MMSE, Braak stage, CERAD, eAMPA, eGABA, and eE/I ratio shows two separated clusters related to the support of synaptic function (text color black) or toxicity (text color red). c Venn diagram of synaptic proteins correlating with at least one of the following variables: Braak, CERAD, and MMSE. Proteins correlating with all three variables from the synaptic function cluster are involved in regulation of endocytosis and purine ribonucleoside triphosphate biosynthetic process. Proteins in the toxicity cluster are involved in the P38 MK2 pathway, and regulation mRNA stability by proteins that bind AU-rich element. d Venn diagram incorporating proteins correlated with electrophysiological parameters showing a separation between proteins participating in the sustenance or toxicity of synaptic function, as shown in b
