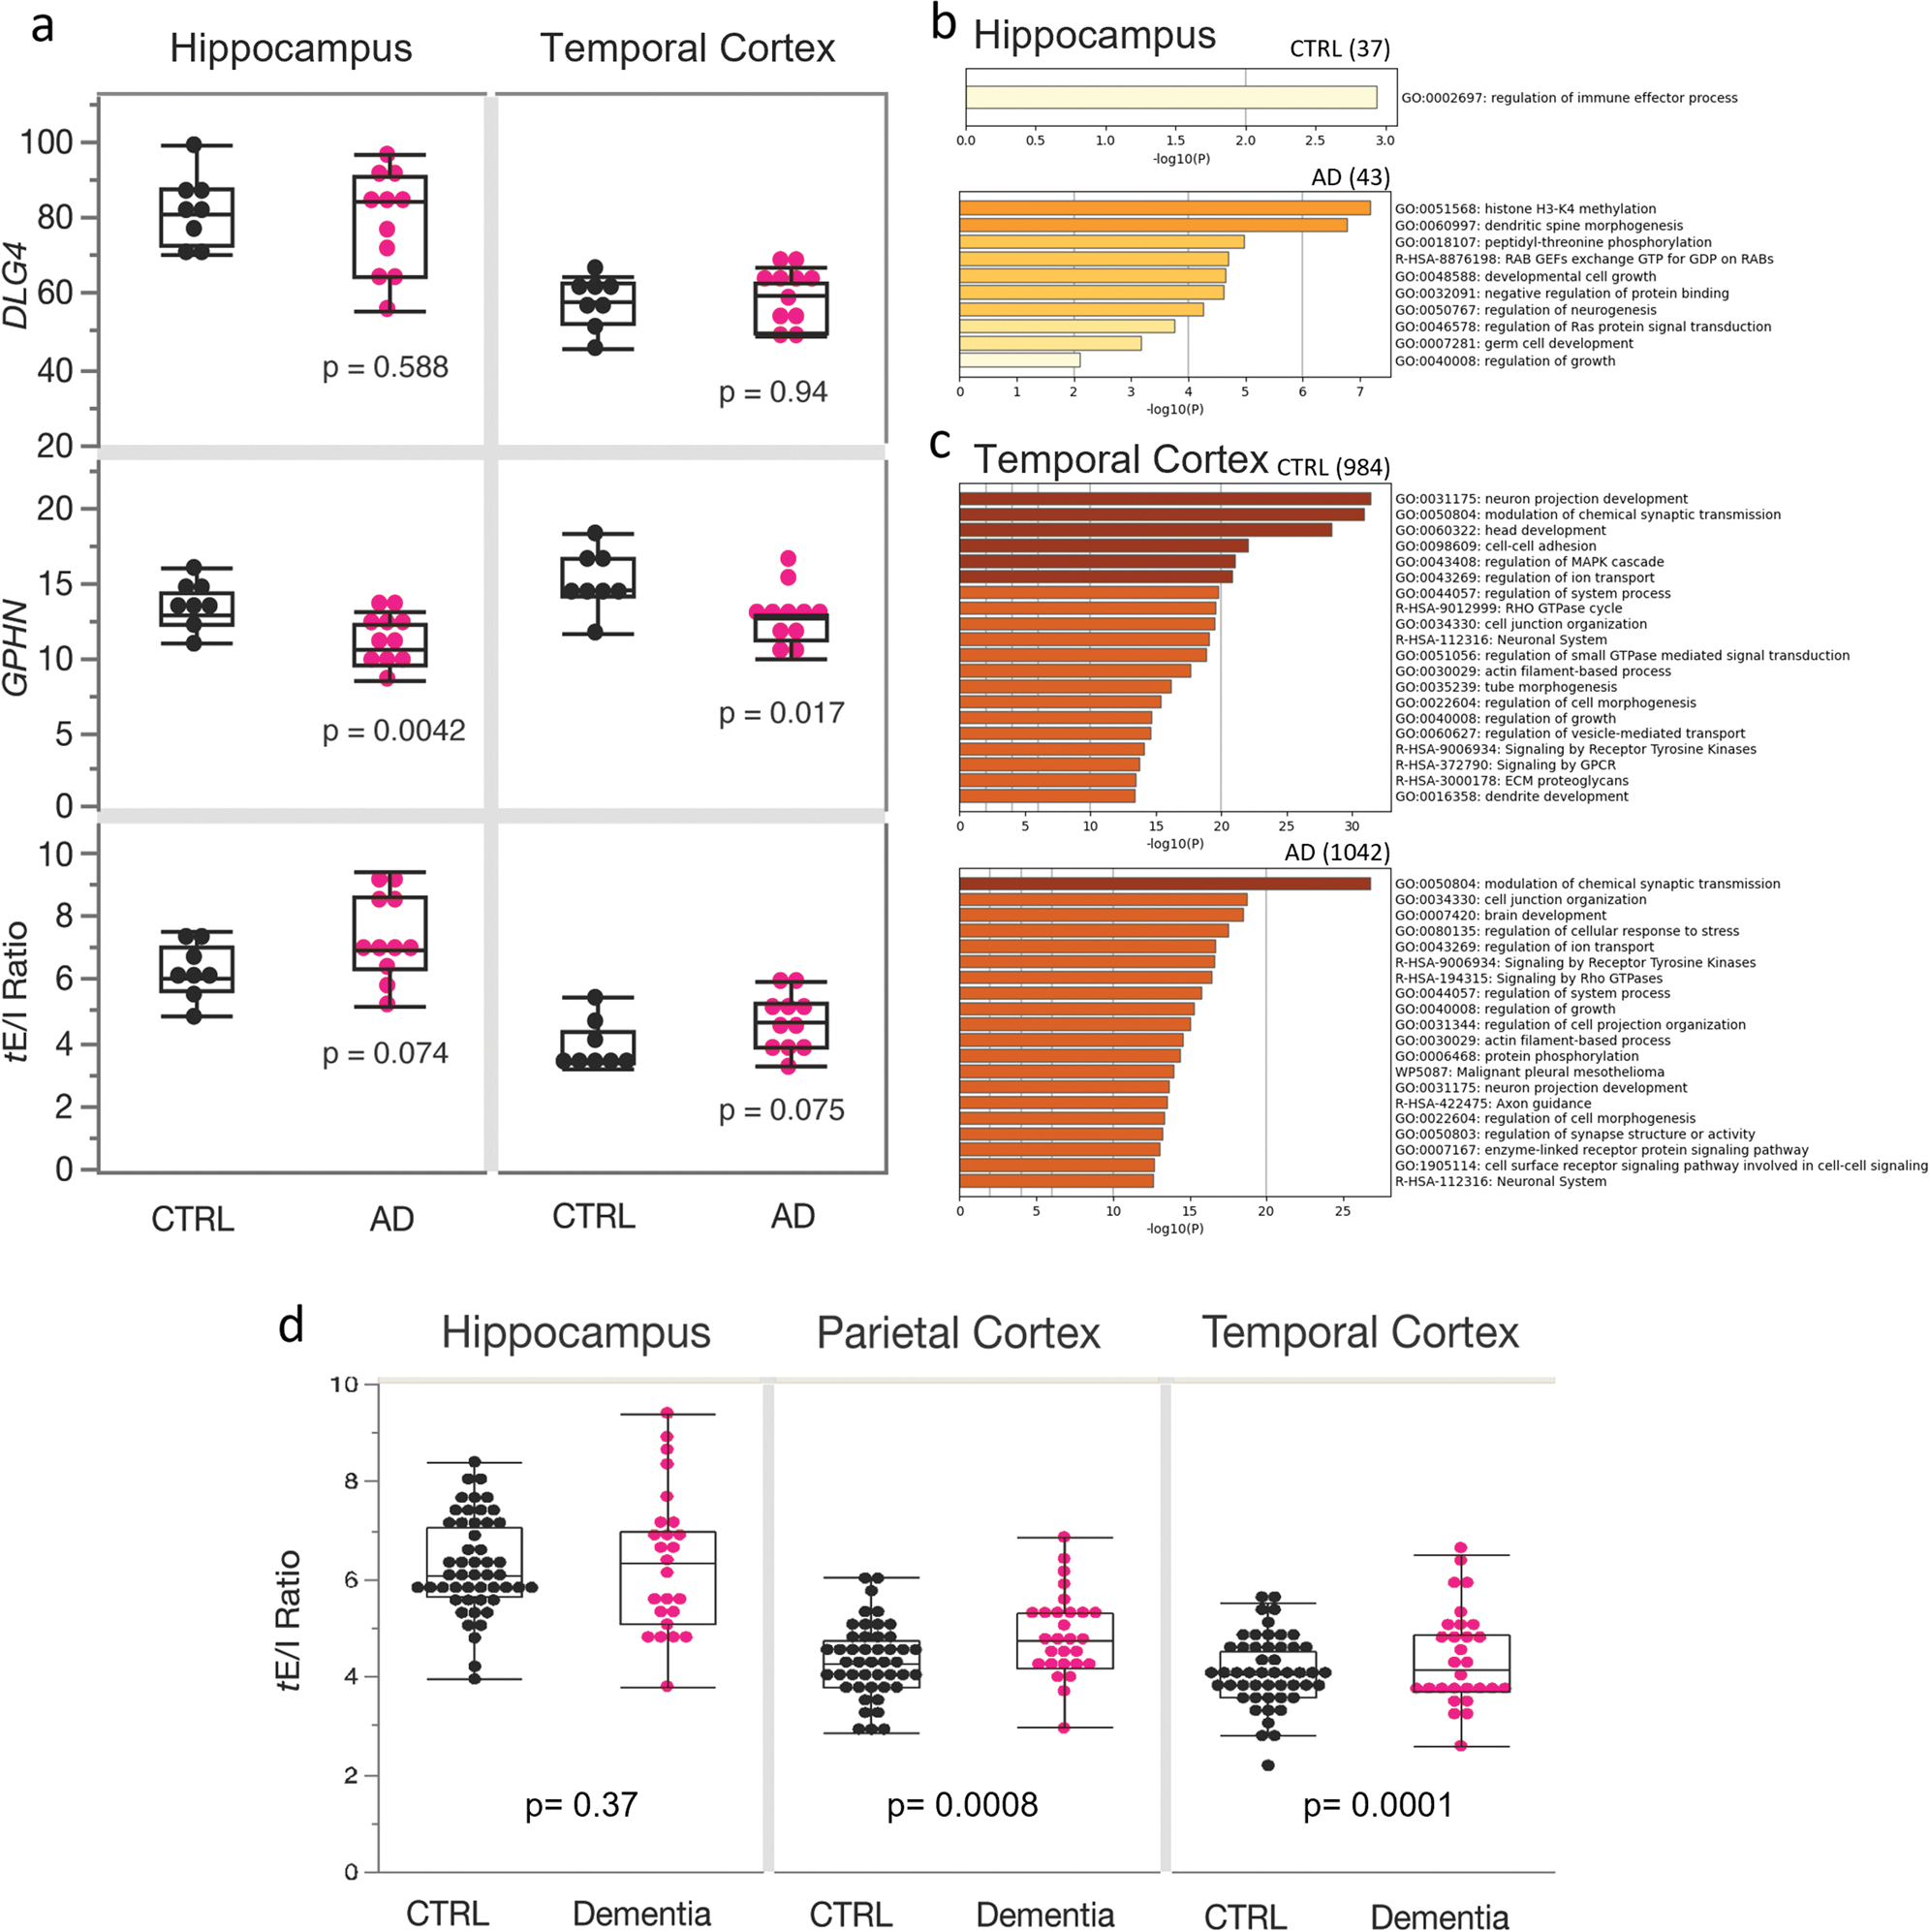
Fig. 4.

Transcriptomic analysis of excitatory and inhibitory synaptic markers in AD and clinical dementia. a RNA-Seq datasets from the ADTBI study show differential alterations in the expression of excitatory (DLG4) and inhibitory (GPHN) postsynaptic density proteins in the hippocampus and TCx of CTRL and AD (n = 8 cognitive healthy CTRL, CERAD = 0 and 12 donors with a DSM-IV clinical diagnosis of dementia of the AD disease type and AD pathology CERAD = 3). The mRNA level of GPHN was significantly decreased in AD donors, both in the hippocampus (F (1, 18) = 10.95, p = 0.0042) and TCx (F (1, 18) = 7.06, p = 0.0166). No changes were found in DLG4 expression levels in AD donors in the hippocampus (F (1, 18) = 0.006, p = 0.9376) and TCx (F (1, 18) = 0.31, p = 0.5877). In both brain regions, the tE/I ratio showed a trend toward pro-excitatory changes in AD (hippocampus: F (1, 18) = 3.63, p = 0.0739; TCX: F (1, 18) = 3.59, p = 0.0752). b, c GO analysis of genes that positively correlate (threshold p = 0.001) with the tE/I balance. The numbers in parentheses show the number of genes in each group that correlate positively with the tE/I ratio. In the AD hippocampus, the tE/I balance was less representative of synapses than the TCx. d The ratio between the expression of DLG4 and GPHN in 56 CTRL and 30 AD subjects in the ADTBI cohort. A two-sided T test was used to compare levels of expression across brain regions. Boxes in a and d extend from the 25th to 75th percentiles, and the whiskers extend to 1.5*IQR (points behind the whiskers are considered outliers)
