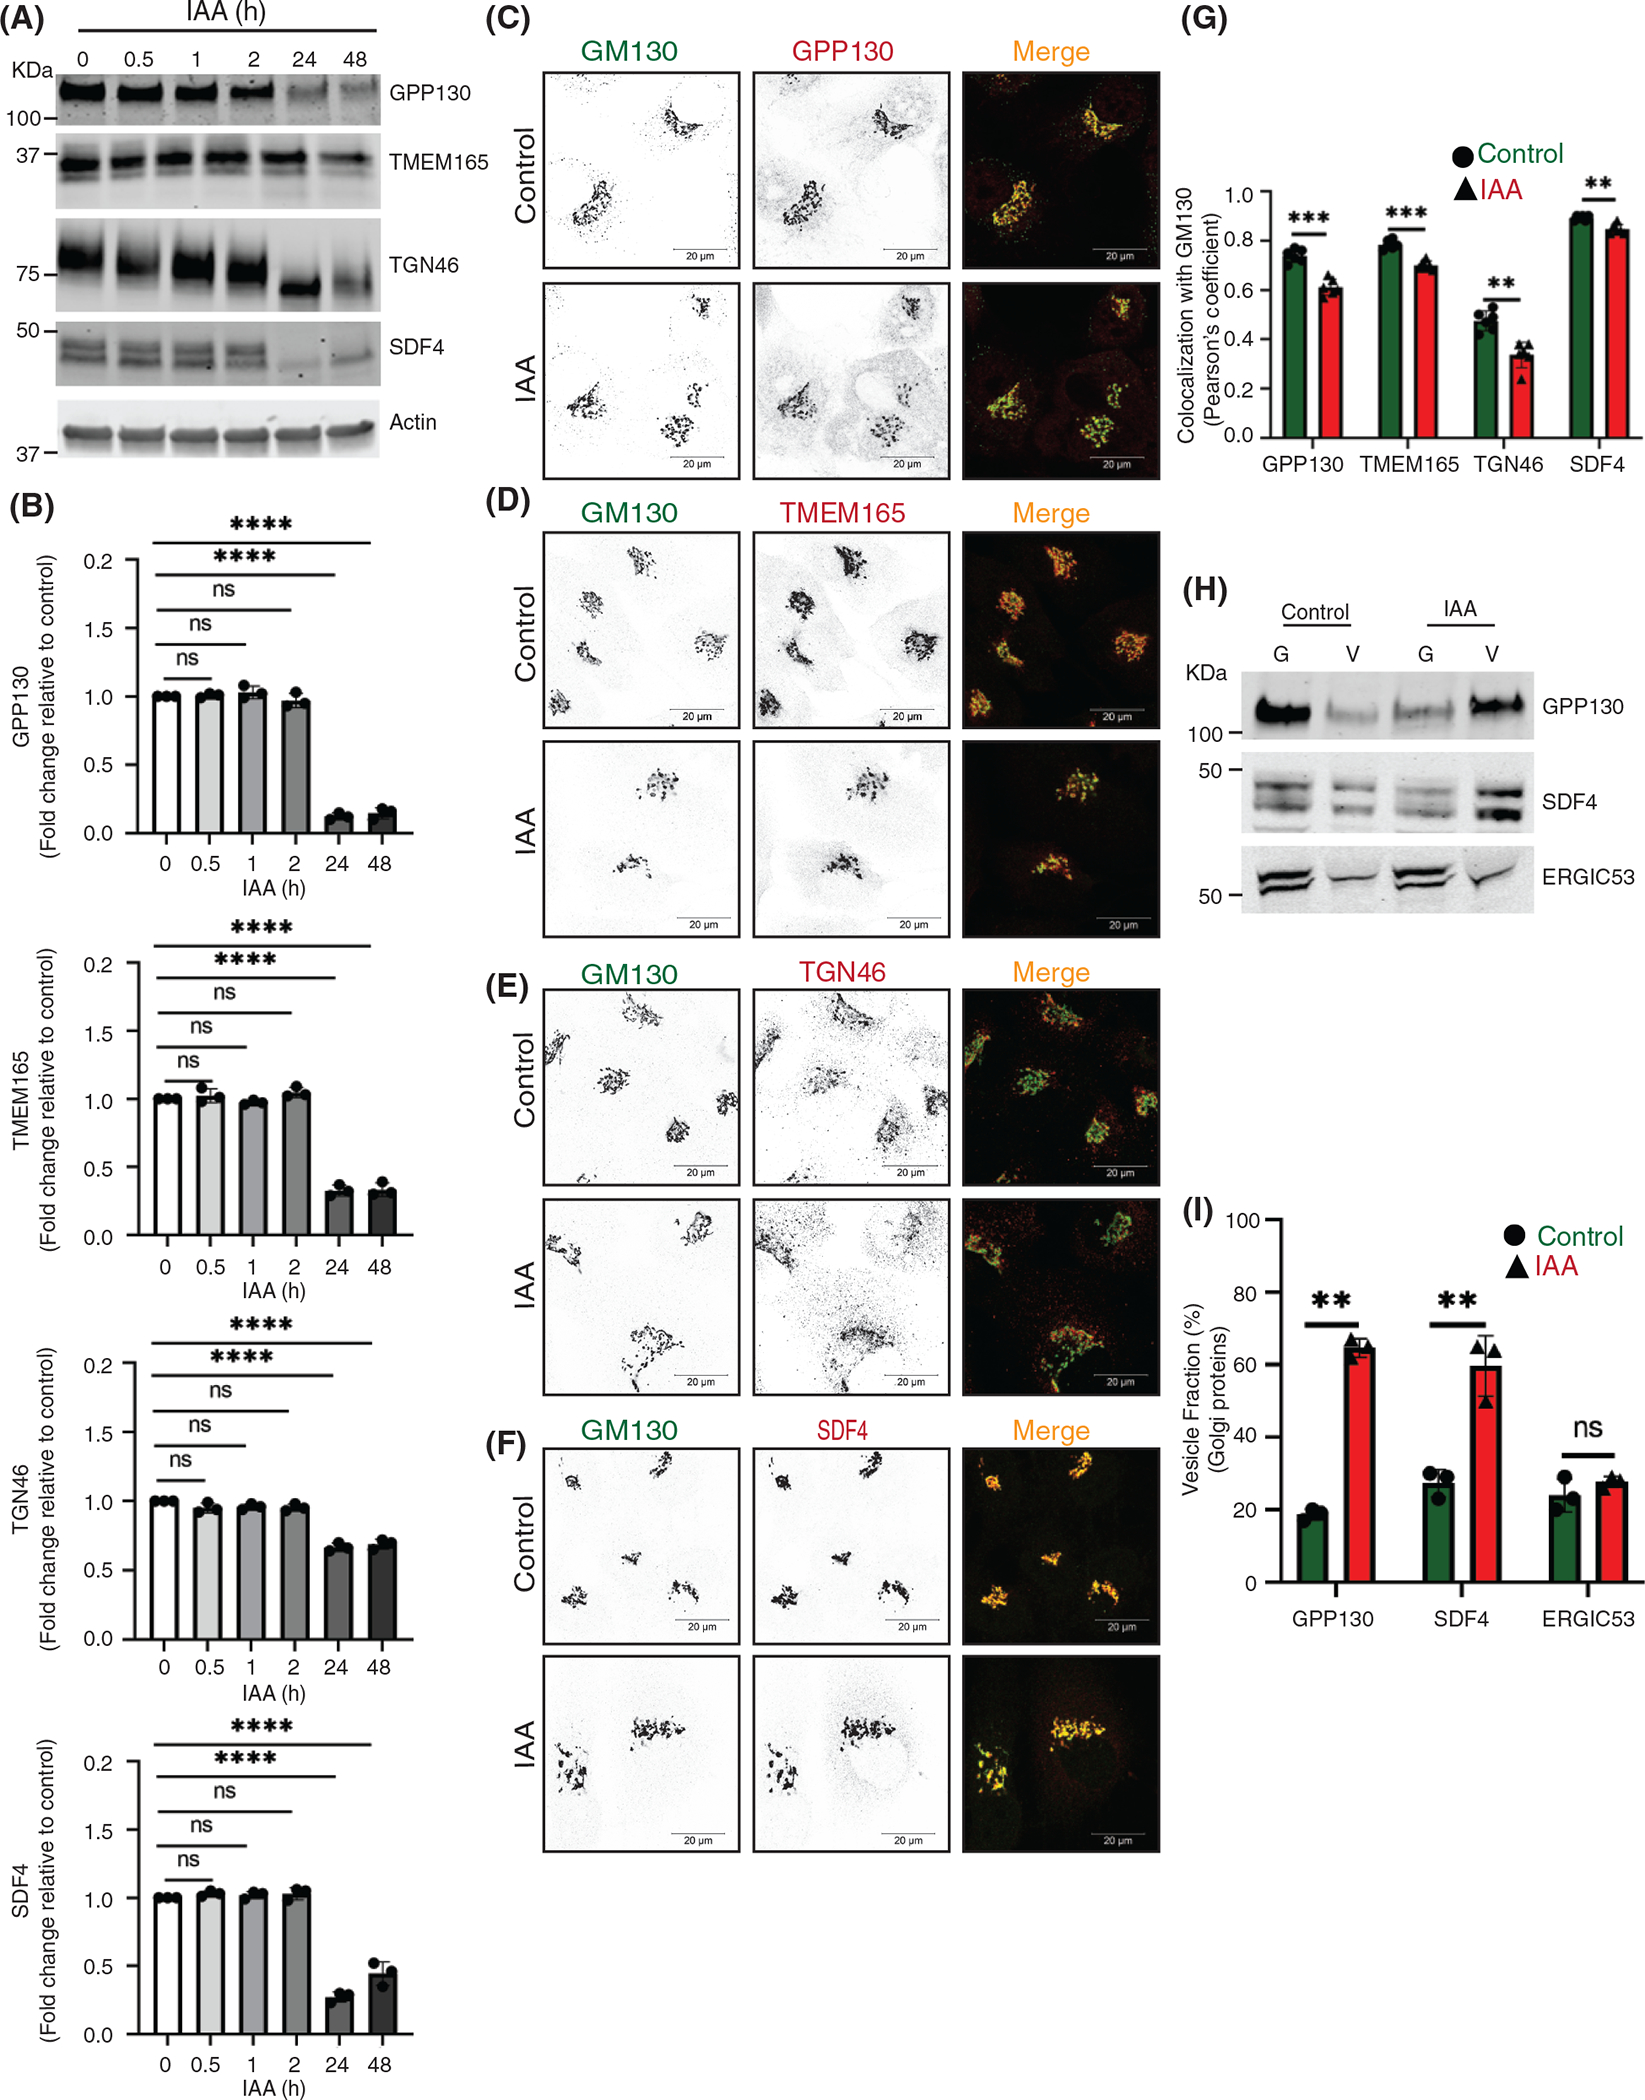
FIGURE 6.

Acute COG4 depletion causes relocalization of Golgi resident proteins into CCD vesicles. (A) WB of time-dependent depletion of COG4-mAID shows the expression of Golgi resident proteins (GPP130, TMEM165, TGN46, and SDF4). 10 μg of total cell lysates were loaded and probed with indicated antibodies. β actin was used as a loading control. (B) The graph represents the quantification of A. In the bar graph, values represent the mean ± SD from three independent experiments. Statistical significance was calculated using one-way ANOVA. P ≥ 0.05, nonsignificant (ns), ****p ≤ 0.0001, significant. (C, D, E, F) Airyscan superresolution IF analysis of untreated (control) or auxin treated (IAA) COG4-mAID cells stained for (C) GM130 (green) and GPP130 (red), (D) GM130 (green) and TMEM165 (red), (E) GM130 (green) and TGN46 (red), (F) GM130 (green) and SDF4 (red), respectively. Scale bars, 20 μm. For better presentation, green and red channels are shown in inverted black and white mode whereas the merged view is shown in RGB mode. (G) Colocalization of Golgi resident proteins with GM130 was determined by calculating Pearson’s correlation coefficient and >90 cells were analyzed. Statistical significance was calculated by GraphPad Prism 8 using paired t-test. Here, ****p ≤ 0.0001, ***p ≤ 0.001, *p ≤ 0.05, significant and p ≥ 0.05 nonsignificant (ns). Error bar represents mean ± SD. (H) WB analysis of GPP130, SDF4, and ERGIC53 in Golgi and vesicle fractions. Equal volumes of Golgi (G) and vesicle (V) membrane fractions were analyzed with antibodies as indicated. (I) The graph represents the quantification of vesicle fraction (%) of Golgi resident proteins in COG depleted cells compared to control. The Golgi protein abundance in vesicles was calculated as a percentage of the immuno signal in the vesicle fraction to the combined signal in Golgi and vesicle fractions from n = 3 independent experiments. Statistical significance was calculated by GraphPad Prism 8 using paired t-test, ****p ≤ 0.0001, ***p ≤ 0.001, *p ≤ 0.05, significant and p ≥ 0.05 nonsignificant (ns). Error bar represents mean ± SD
