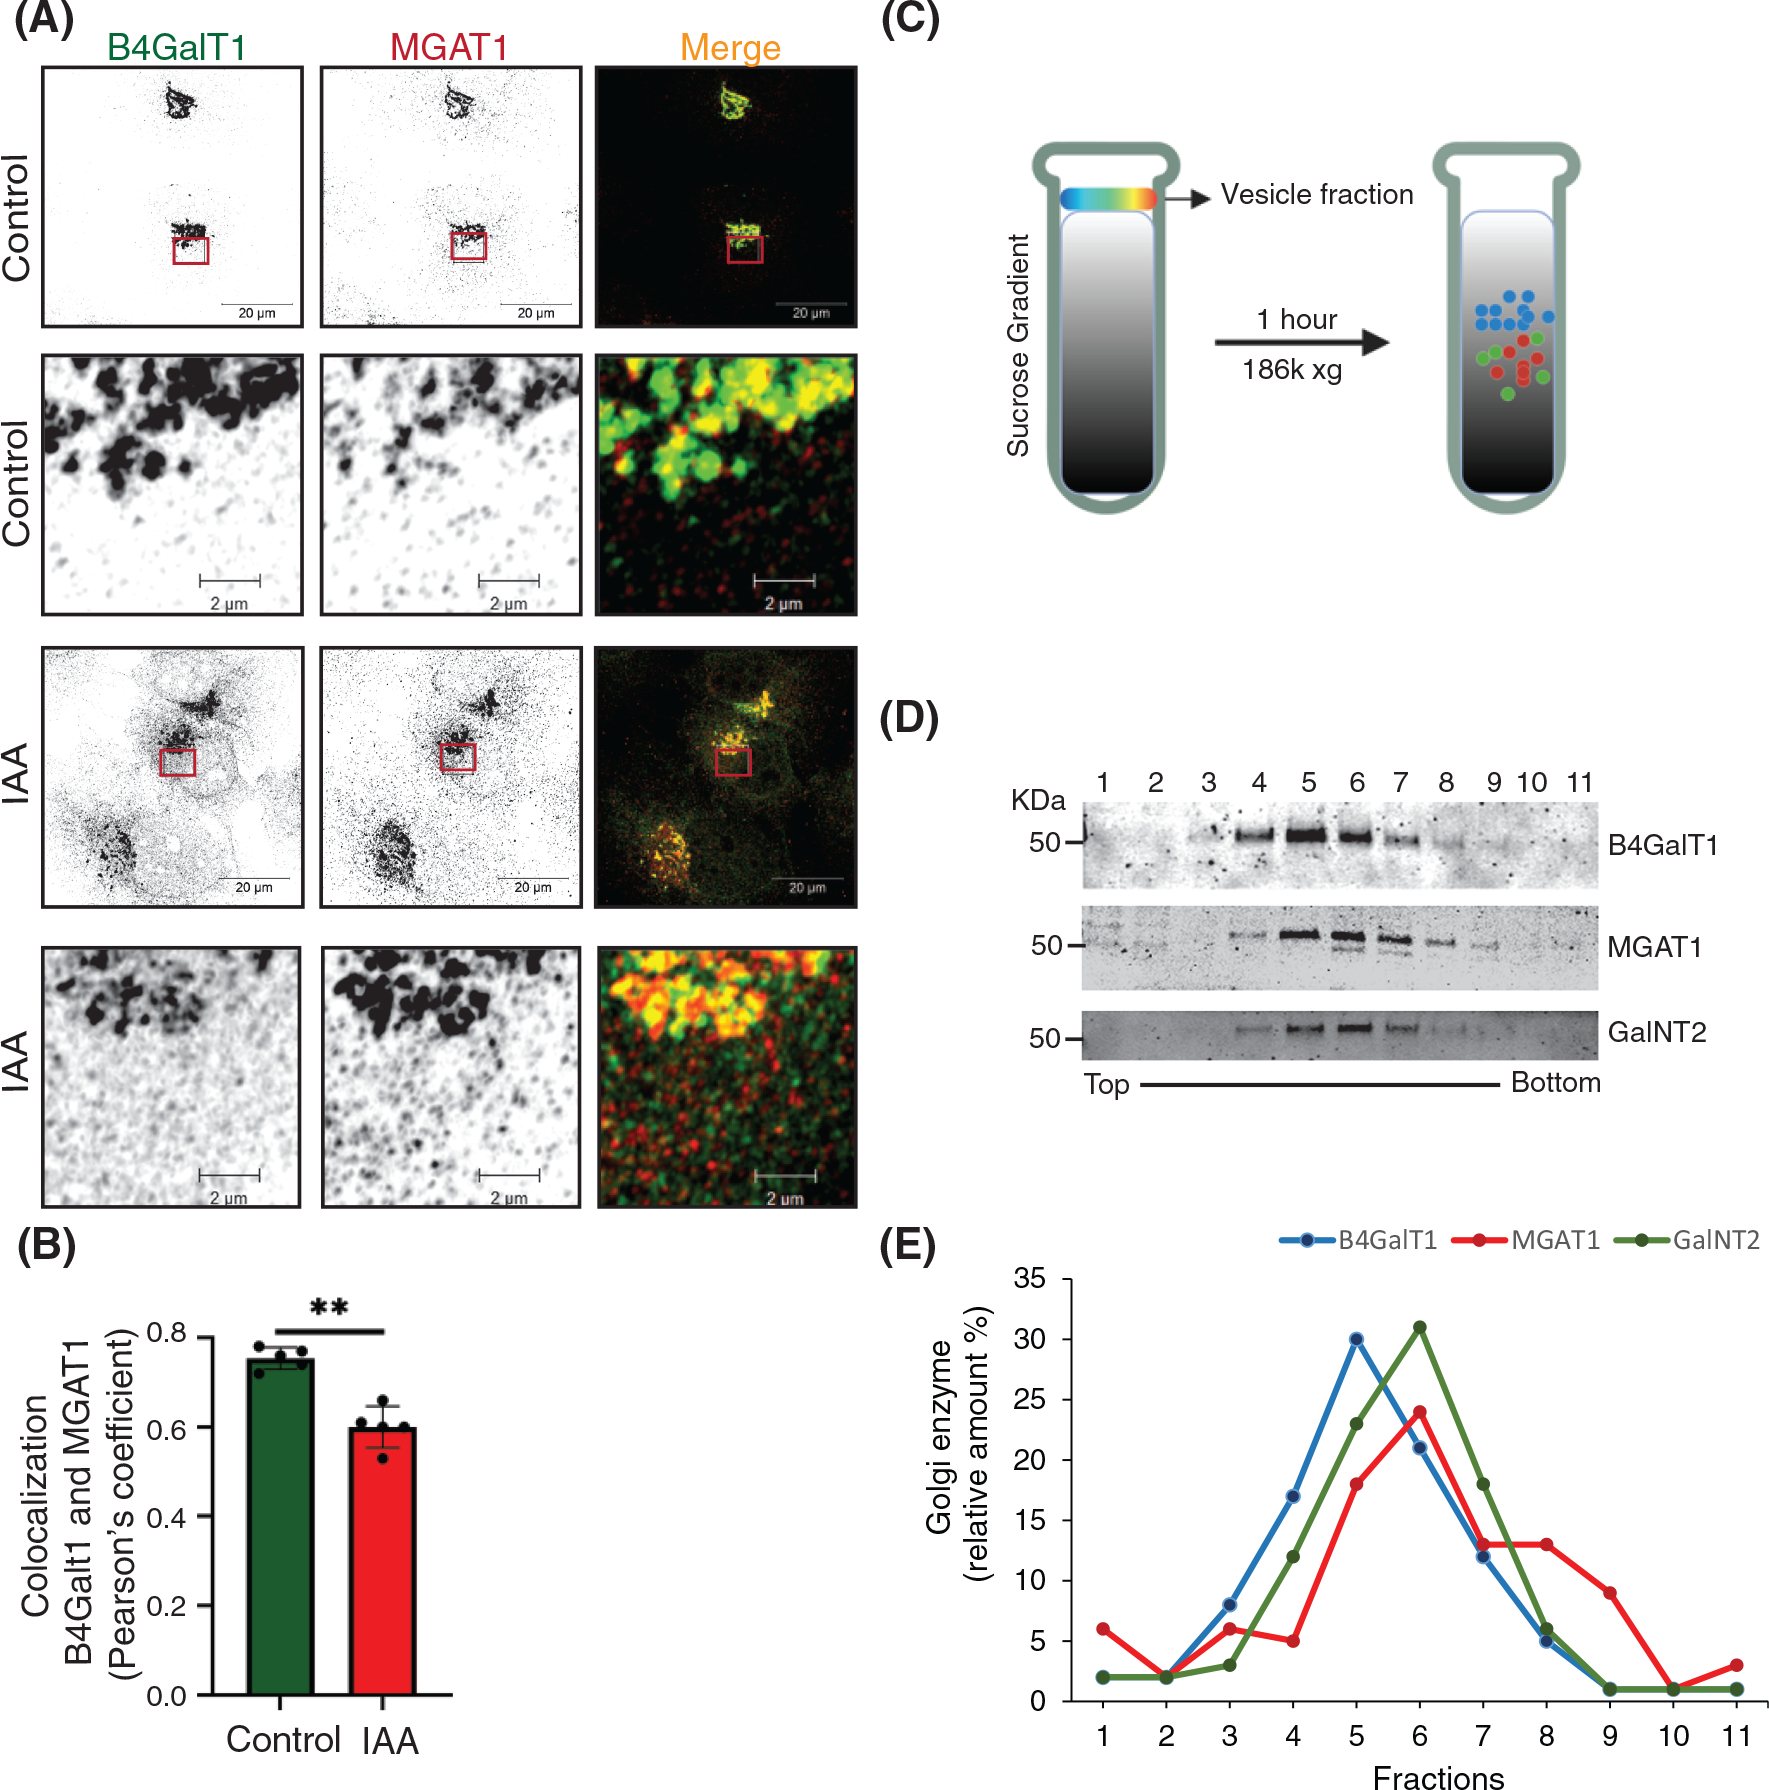
FIGURE 8.

B4GalT1 and MGAT1 recycle in distinct CCD vesicles. (A) Airyscan superresolution IF analysis of untreated (control) or IAA treated COG4-mAID cells stained for B4GalT1 (green) and MGAT1 (red). Scale bars, 20 μm. The enlarged (5×) view of the framed area of the upper panel is shown in the bottom panel. For better presentation, green and red channels are shown in inverted black and white mode whereas the merged view is shown in RGB mode. (B) Colocalization of B4GalT1 with MGAT1 was determined by calculating Pearson’s correlation coefficient, >90 cells were analyzed. Statistical significance was calculated by GraphPad Prism 8 using paired t-test. Here, **p ≤ 0.001, (significant). Error bar represents mean ± SD. (C) Schematic representation of CCD vesicle fractionation by sucrose velocity gradient centrifugation. (D) WB of vesicle fractions separated by sucrose gradient fractions tested for B4GalT1, MGAT1, and GalNT2. (E) The line graph represents the quantification of D
