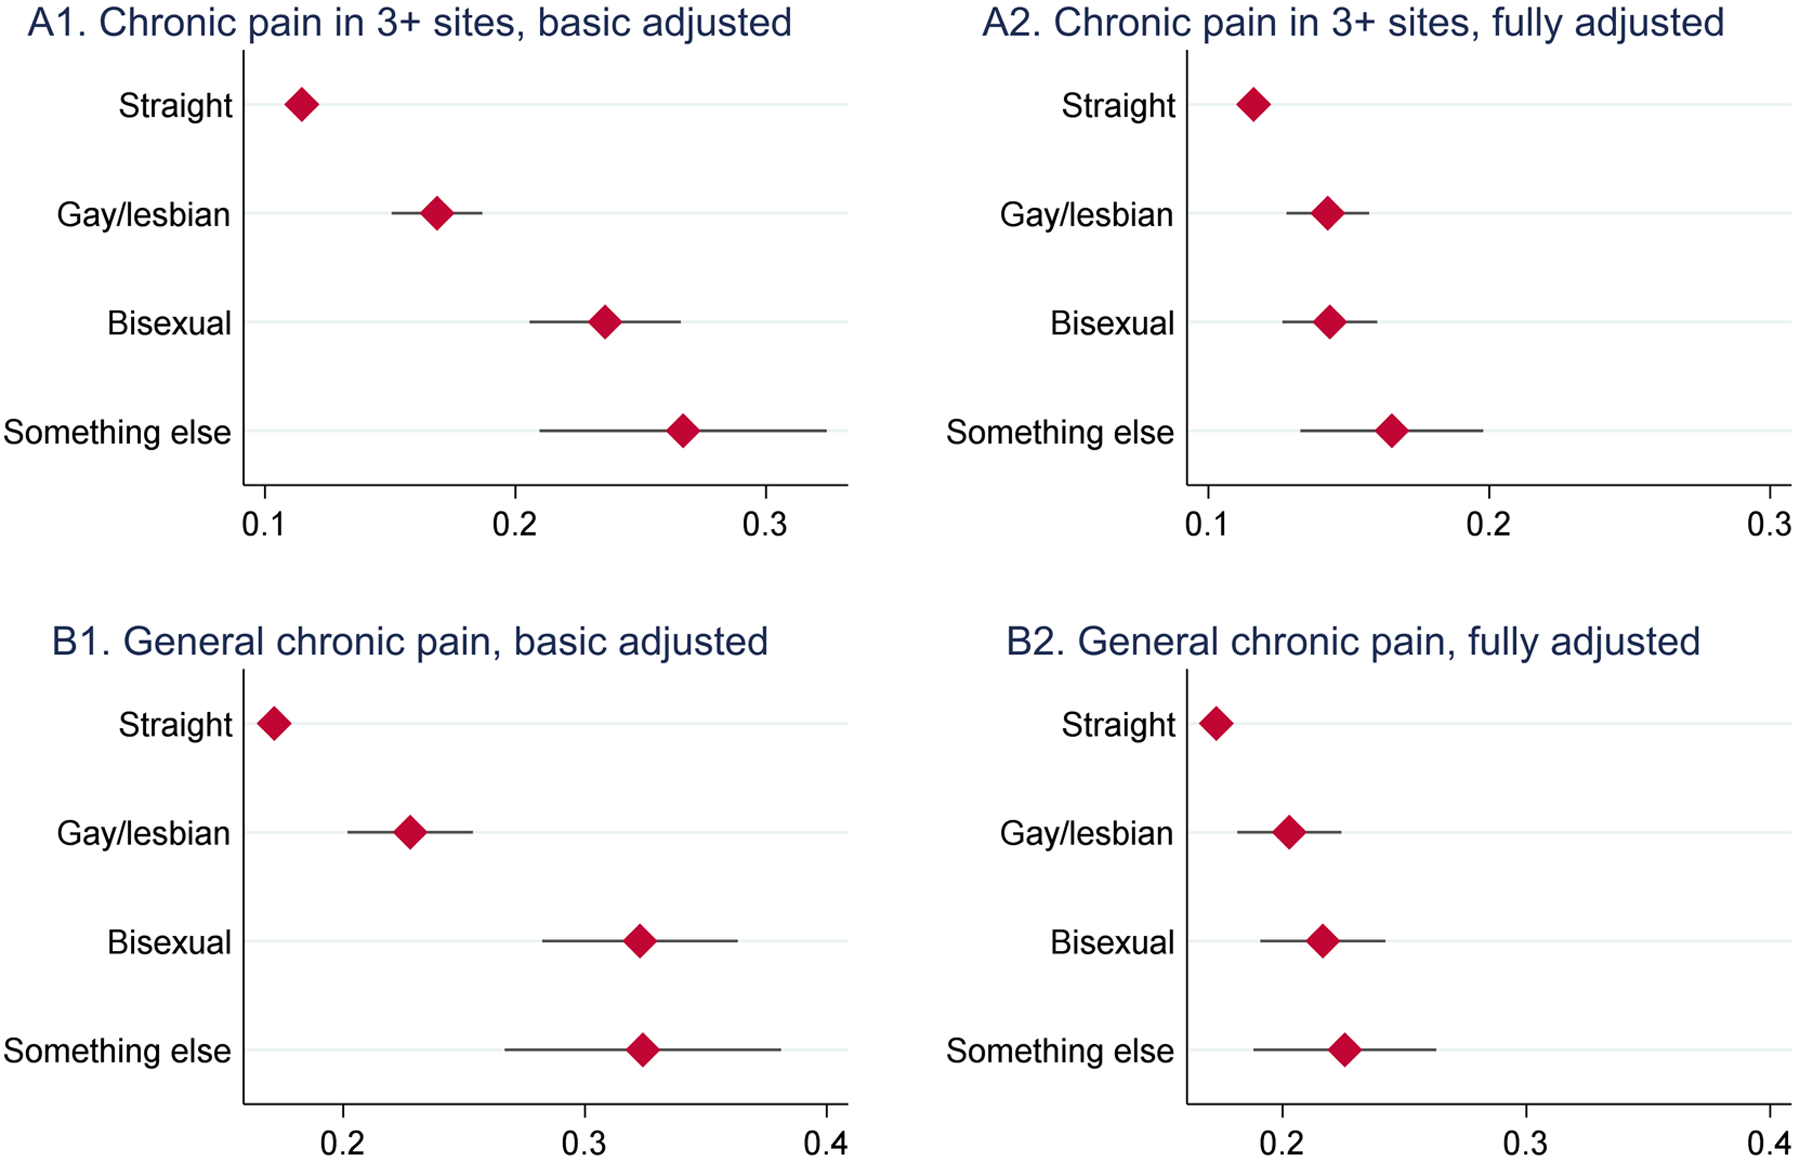
Figure 2.

Predicted probability of pain across sexual identity groups
Note
NHIS 2013–2018, US adults age 18–64
Figures show average predicted probabilities of pain (pain in 3+ sites and chronic pain) and their 95% confidence intervals for the population estimates from complex survey-adjusted modified/robust Poisson models.
Model 1 adjusts for age, age squared, sex, and year.
Model 2 adjusts for all covariates.
