
Figure 2.
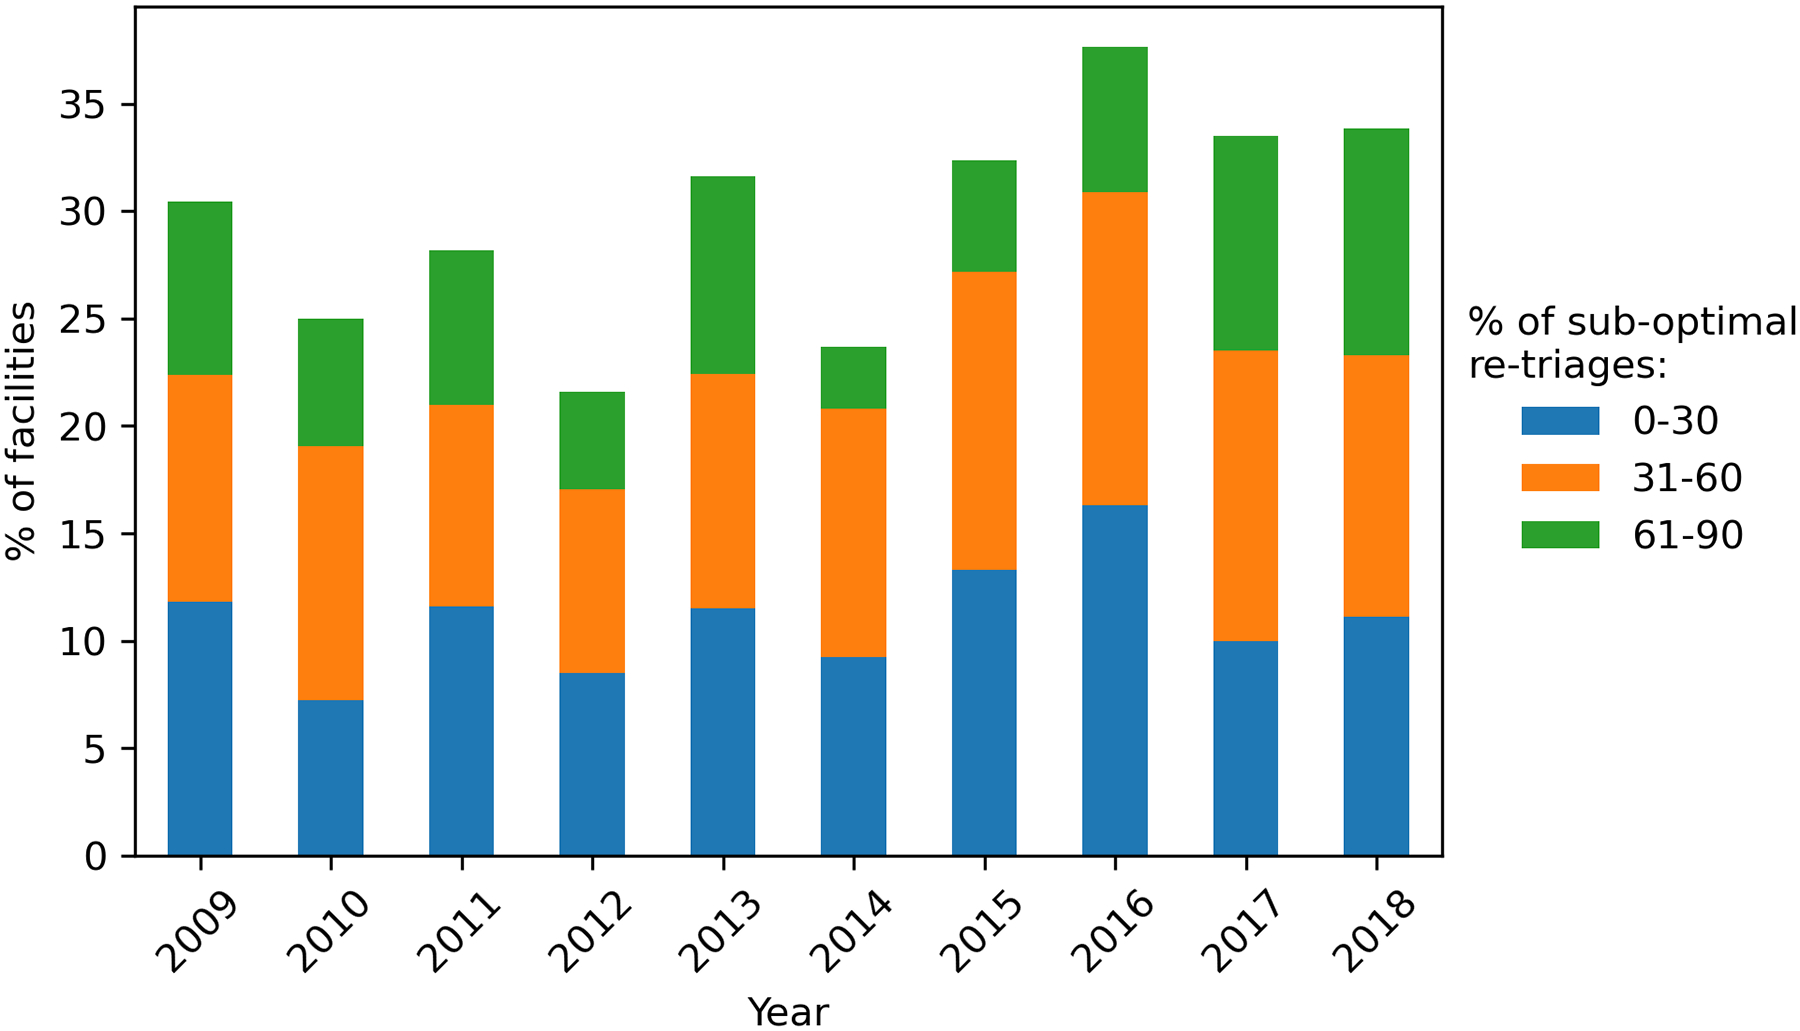
The Proportion of Non-trauma or Level III/IV Trauma Centers with At-least One Sub-Optimal Re-triage by Year with Center-level Sub-Optimal Re-triage Rate. The proportion of non-trauma or Level III/IV trauma centers with at least one sub-optimal re-triage in each calendar year from 2009 to 2018. stacked bar-graph colored segment denotes center-level sub-optimal re-triage rate (ranging from 10–90 % per figure legend).