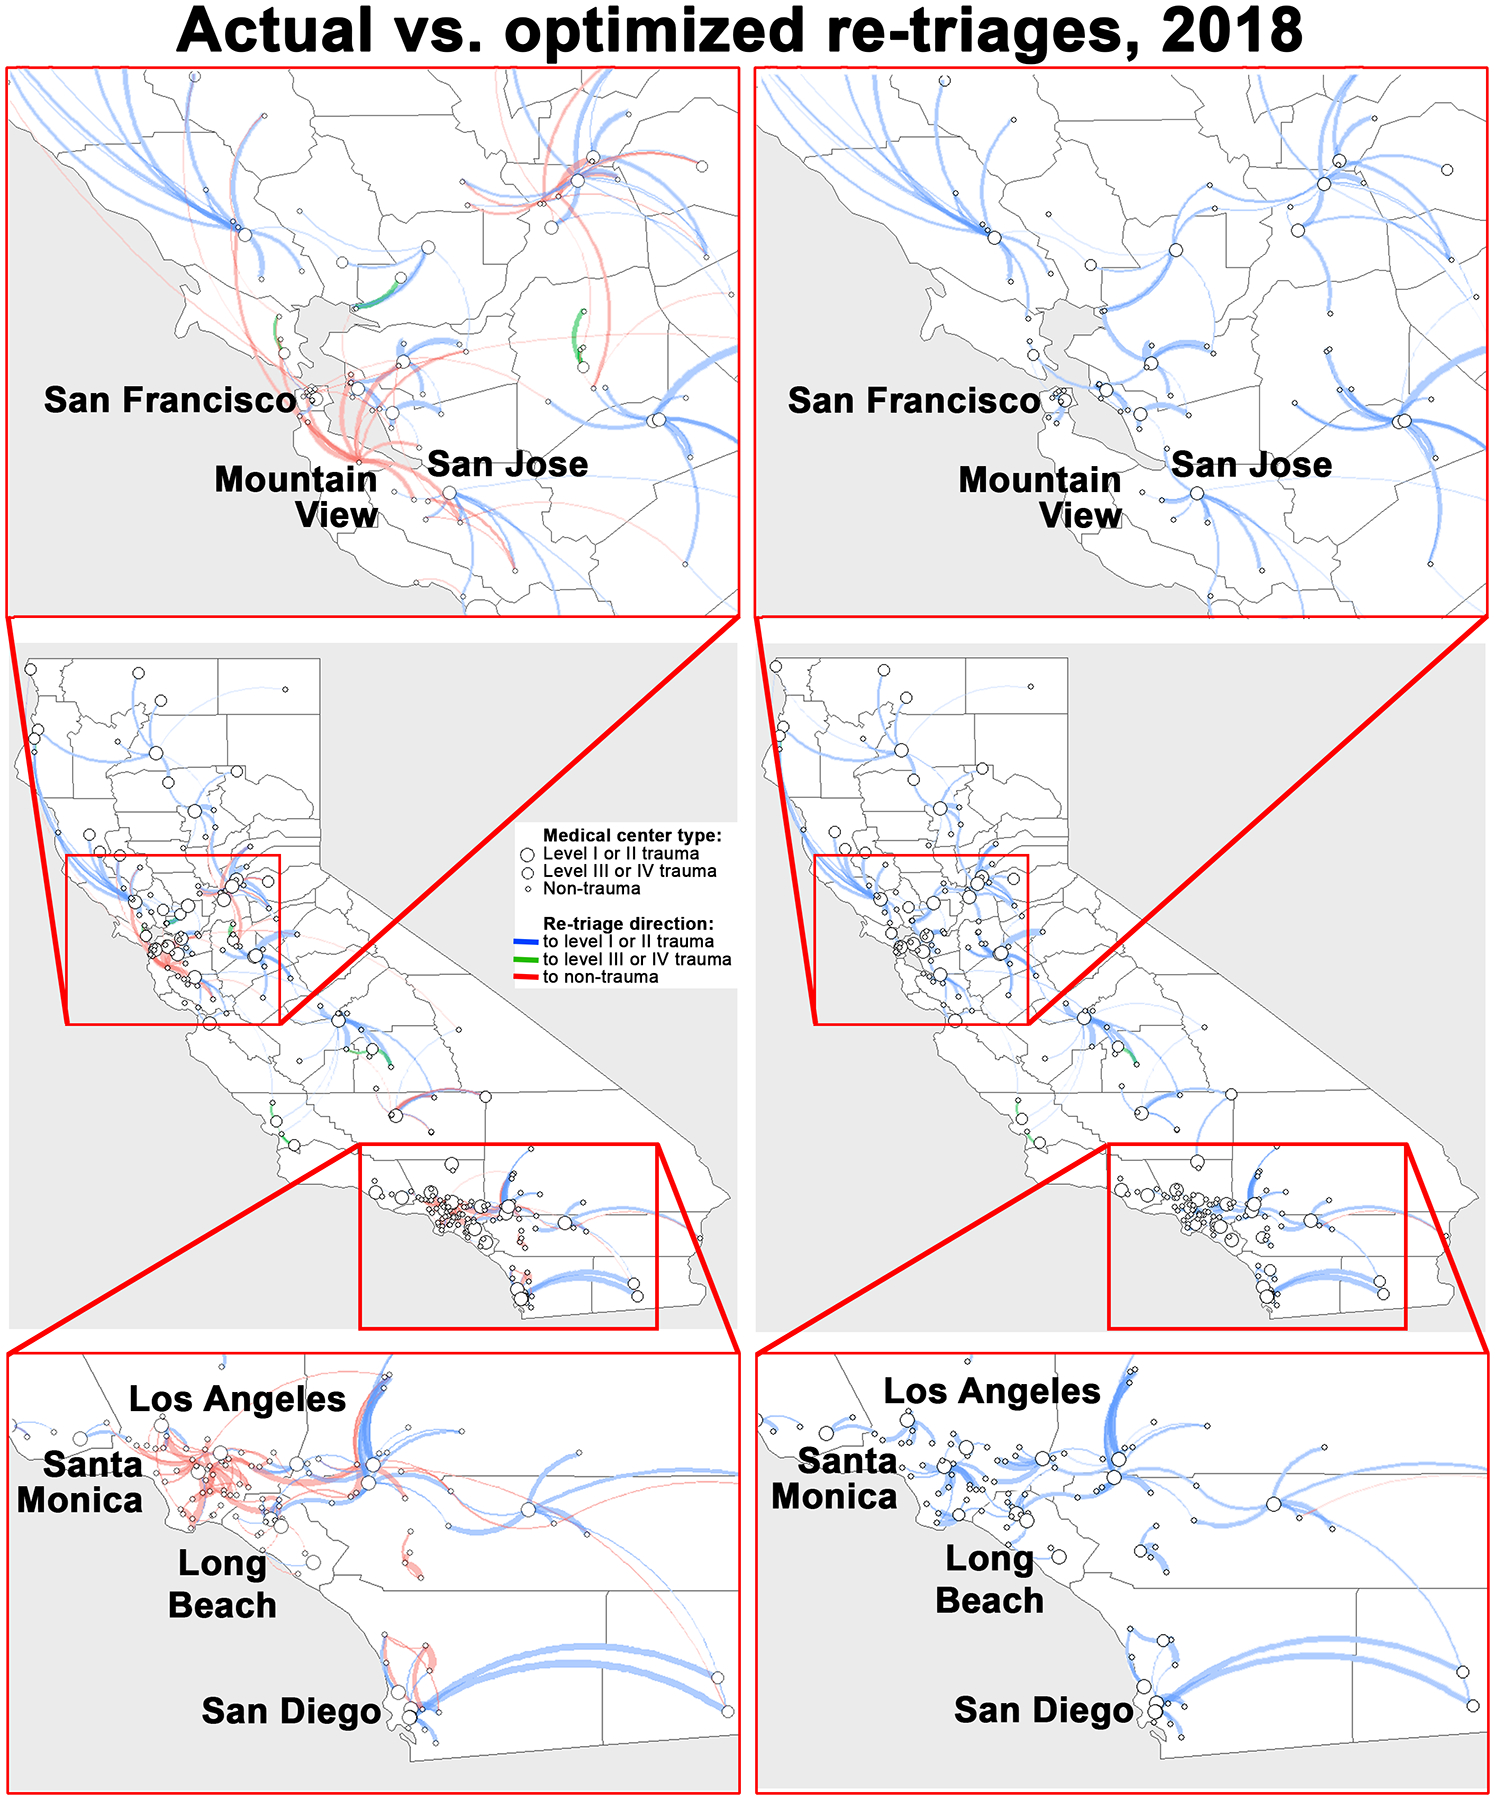
Figure 3.

Actual (left panel) vs. Optimized (right panel) re-triages in 2018 in California’s trauma system. The re-triage volumes between centers were reflected by the thickness of the lines connecting the medical centers. The blue lines show optimal re-triages to Level I or II trauma, the red lines show sub-optimal re-triages between non-trauma centers, and the green lines show sub-optimal re-triages between non-trauma centers and Level III or IV trauma centers.
