
Fig. 1. Identification of virus-neutralizing coldspot antibodies.
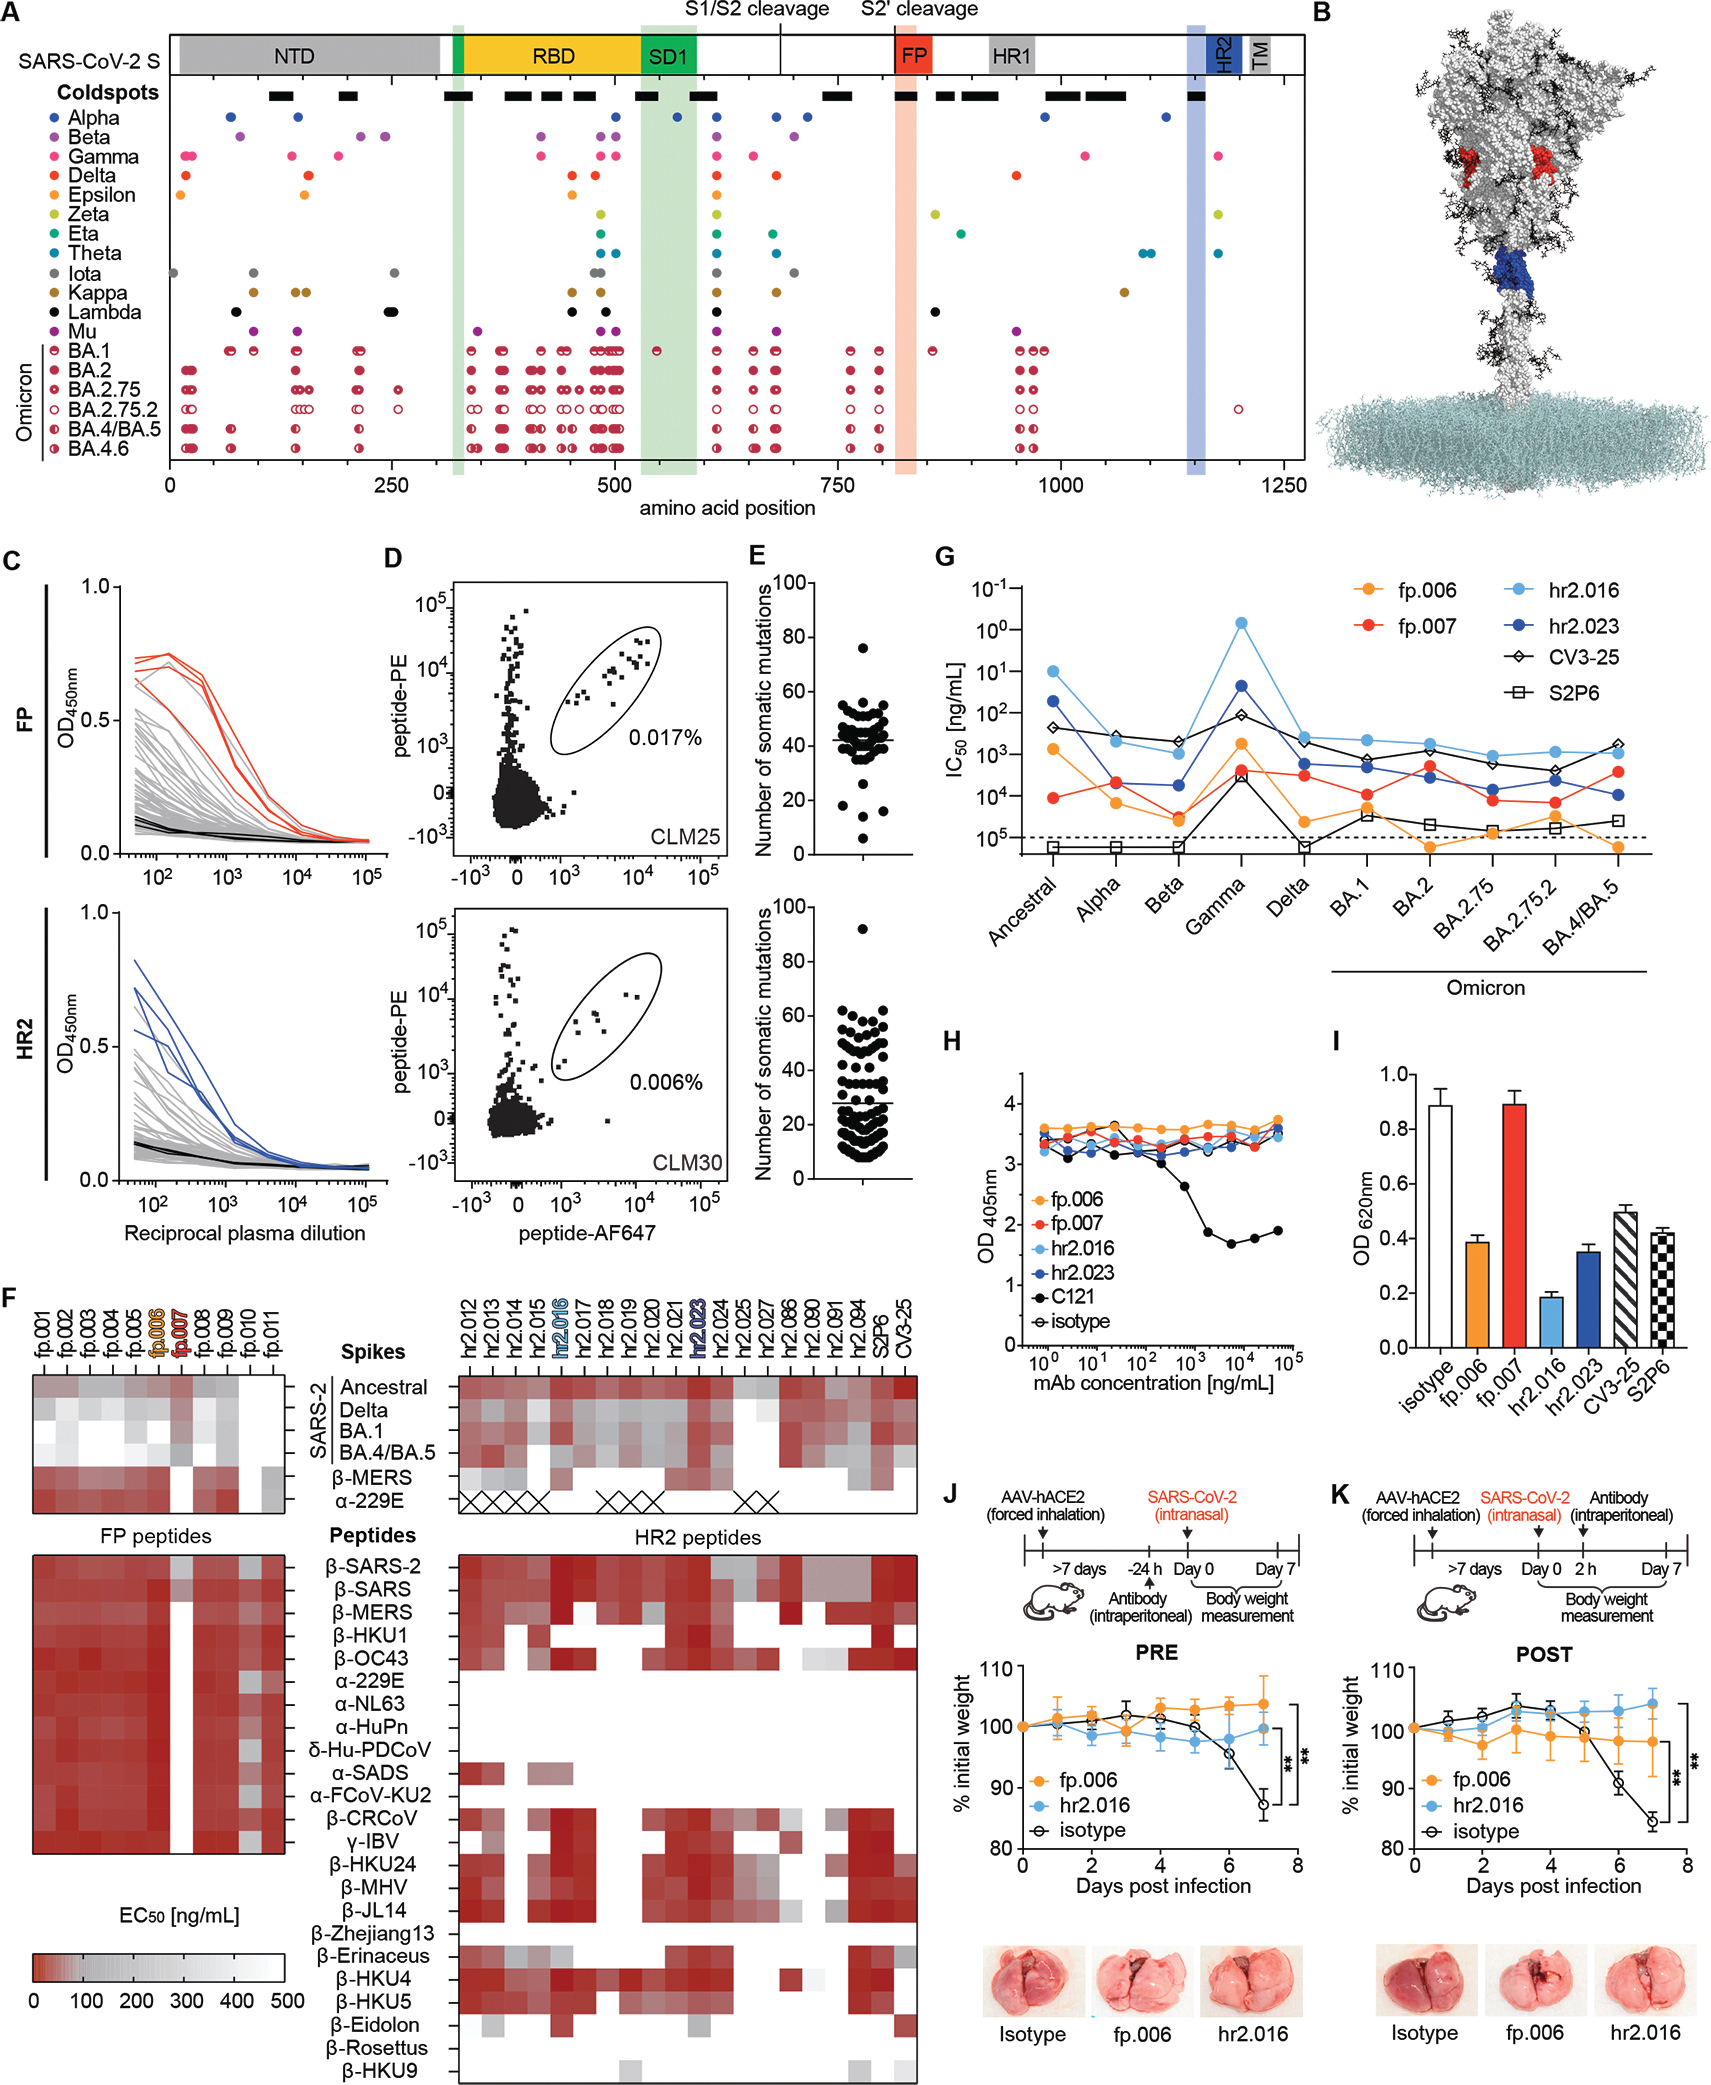
(A) On top, cartoon diagram of the SARS-CoV-2 spike with highlighted coldspot areas at the fusion peptide (FP, red), heptad repeat 2 region (HR2, blue), and subdomain 1 (SD1, green). Thick horizontal lines indicate the location of all coldspots (see also fig. S1A). At the bottom, amino acid changes in SARS-CoV-2 variants. Each circle represents a single aa substitution over ancestral virus. (B) Structure of the SARS-CoV-2 spike; FP (aa 814–838) and HR2 (aa 1142–1161) coldspots are in red and blue, respectively (PDB: 6XM4). (C) ELISA measurements of convalescent plasma IgG reactivity to FP (top) or HR2 (bottom) peptides. Optical density units at 450 nm (OD, Y axis) and reciprocal plasma dilutions (X axis). Non-infected controls in black; samples selected for cell sorting by flow cytometry are in red or blue. Two independent experiments. (D) Representative flow cytometry plots of B cells binding to fluorescently labeled FP (top) or HR2 (bottom) peptides. Numbers indicate percentage of double-positive cells in the gate. (E) Number of heavy and light chain V gene somatic mutations of antibodies to the FP (top) or HR2 (bottom) peptides. (F) Heatmaps with ELISA EC50 values of monoclonal antibodies binding to the S of CoVs (top) and to the FP and HR2 peptides (bottom) corresponding to the CoV species, whose genus is indicated by Greek letters. The monoclonal antibodies to the HR2 region S2P6 (16) and CV3-25 (17) were assayed alongside for comparison. Cross indicates not tested. Two experiments. (G) Graph with IC50 values of monoclonal antibodies neutralizing pseudoviruses corresponding to the indicated VOC. Two experiments. (H) ACE2 binding to ancestral S in ELISA in the presence of select FP and HR2 antibodies. Dotted line represents the limit of detection. Two experiments. (I) Inhibition of cell fusion by FP and HR2 antibodies. (J and K) fp.006 and hr2.016 antibodies protect in vivo. Top, diagram of the experiment’s timeline. Middle, mouse weight over time after challenge with ancestral SARS-CoV-2 of AAV-hACE2 mice treated with antibodies either 24 hours before ((J); n=6 per group, p=0.0022 for both fp.006 and hr2.016 versus isotype at day 7), or 2 hours after ((K); n=5 per group, p=0.0079 for both fp.006 and hr2.016 versus isotype at day 7) the infection. Mann-Whitney U test, standard deviation is shown. At the bottom, representative lung images at day 7.