
Extended Data Figure 2.
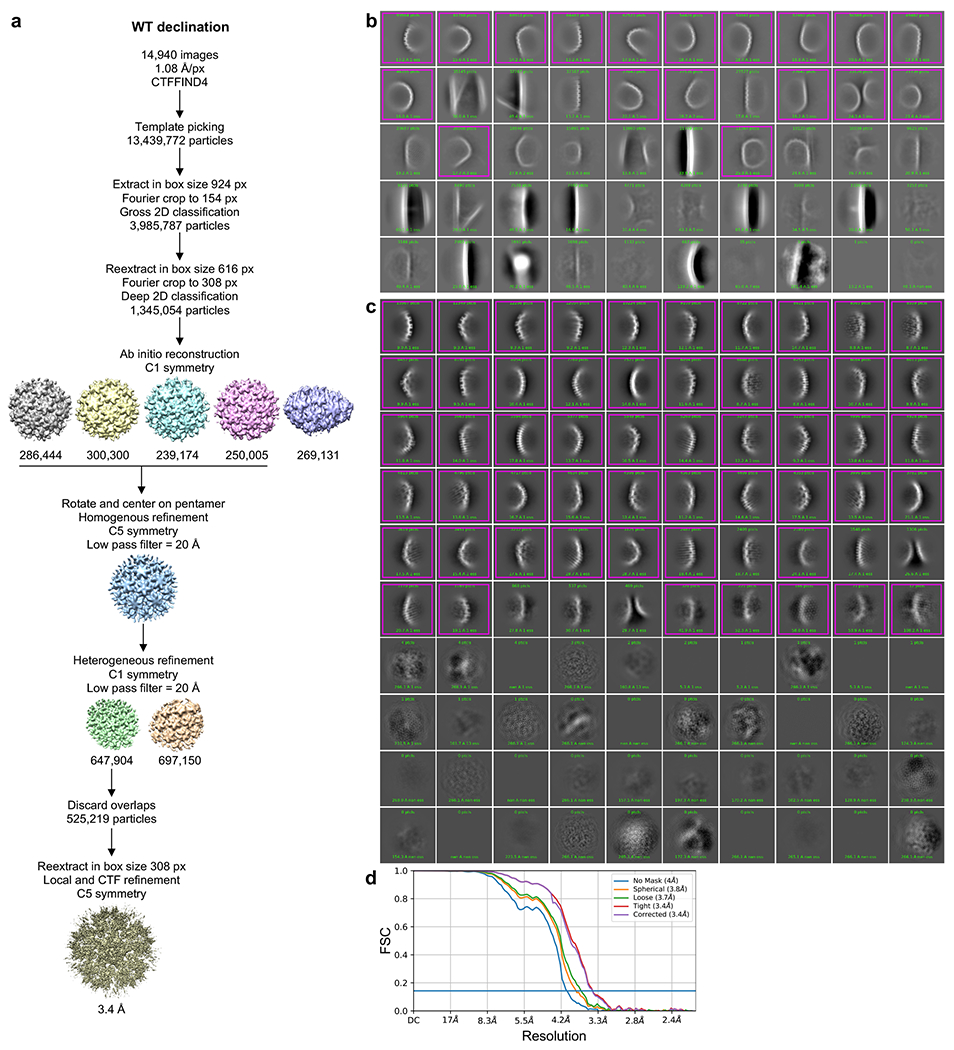
(a) Single particle averaging workflow for the WT declination. After the template picking step, particles were randomly split into 4 subsets to facilitate computations up to the ab initio reconstruction step. (b) Representative result of initial 2D classification of particles extracted in box size 924 px (998 Å). Magenta indicates classes selected for further processing. (c) Representative result of 2D classification of particles reextracted in box size 616 px (665 Å). (d) Fourier shell correlation (FSC) plot from the final refinement round.