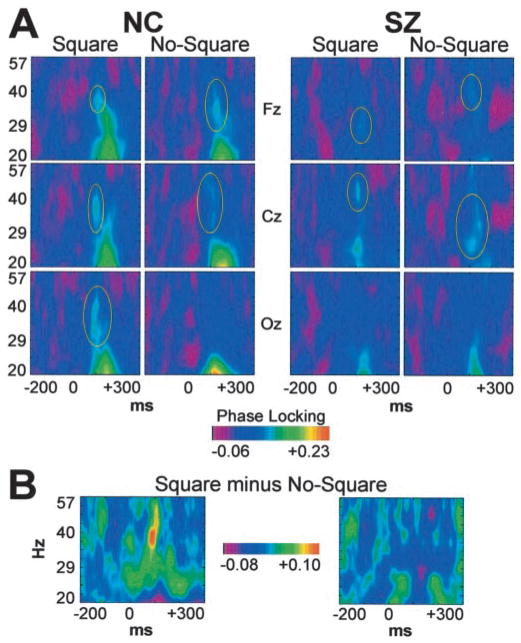
Figure 2.
Group average time-frequency maps of phase locking. A, Midline frontal (Fz), central (Cz), and occipital (Oz) sites. The early evoked gamma band response (circled in yellow) can be distinguished from the low-frequency VEP. B, Square minus No-Square difference map at the left occipital site (O1).

