
Figure 1.
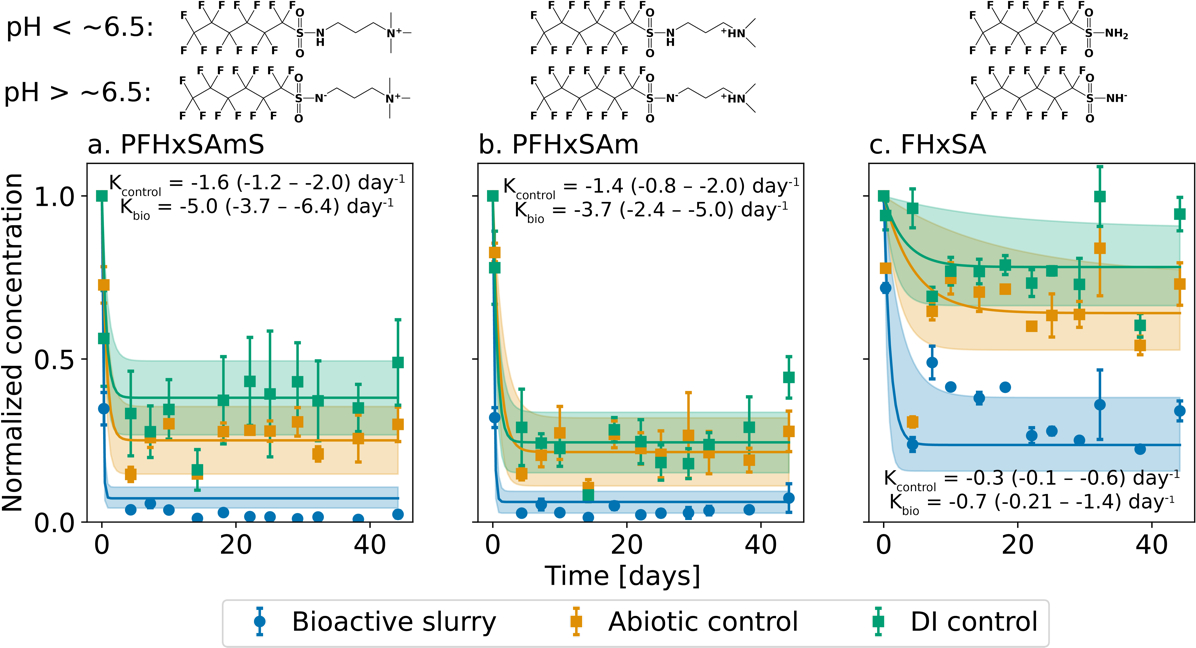
Time-dependent loss of PFAS precursors in a water-sediment slurry incubated at 29°C. Means (circles = bioactive; squares = controls) and standard deviation (error bars) of measurements ( per timepoint) are shown as values normalized to the input concentration. Data were modeled using Equation 2. Solid lines show modeled values (expected mean), and shaded regions represent the 90th percentile (%) confidence intervals (CI). Rates (days−1, expected mean and 90th% CI) are shown in text on each panel. The structure of each precursor is shown above the panels including species likely to be abundant in the range of experimental pH according to their pKa values computed using a physicochemical calculator (SPARC).45